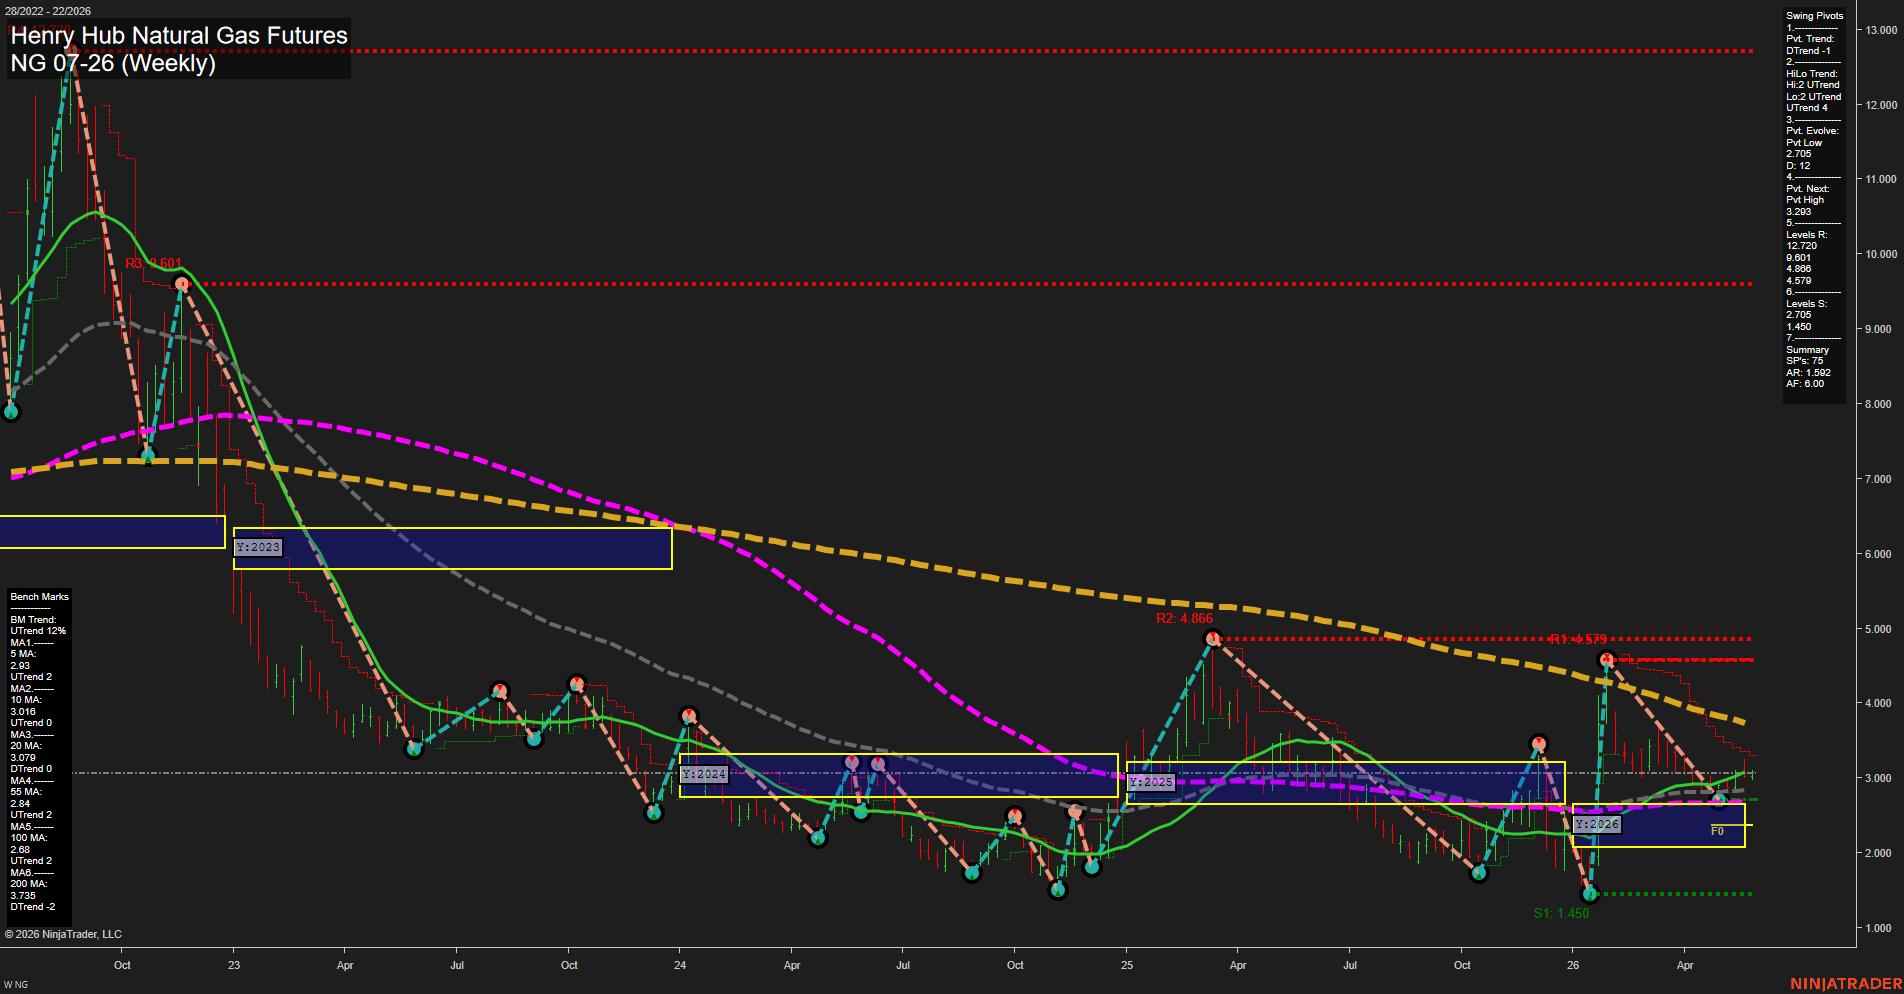
NG Henry Hub Natural Gas Futures Weekly Chart Analysis: 2026-May-26 07:04 CT
Price Action
- Last: 3.096,
- Bars: Medium,
- Mom: average.
WSFG Weekly
- Short-Term
- WSFG Current: 20%
- F0%/NTZ' Bias: Price Above,
- WSFG Trend: Up.
MSFG Month May
- Intermediate-Term
- MSFG Current: 24%
- F0%/NTZ' Bias: Price Above,
- MSFG Trend: Up.
YSFG Year 2026
- Long-Term
- YSFG Current: 24%
- F0%/NTZ' Bias: Price Above,
- YSFG Trend: Up.
Swing Pivots
- (Short-Term) 1. Pvt. Trend: DTrend,
- (Intermediate-Term) 2. HiLo Trend: UTrend,
- 3. Pvt. Evolve: Pvt Low 2.705,
- 4. Pvt. Next: Pvt High 5.293,
- 5. Levels R: 12.720, 9.601, 4.866, 4.579,
- 6. Levels S: 2.705, 1.450.
Weekly Benchmarks
- (Short-Term) 5 Day: 2.930 Up Trend,
- (Short-Term) 10 Day: 3.016 Up Trend,
- (Intermediate-Term) 20 Day: 3.079 Down Trend,
- (Intermediate-Term) 55 Day: 2.840 Up Trend,
- (Long-Term) 100 Day: 2.680 Up Trend,
- (Long-Term) 200 Day: 3.735 Down Trend.
Recent Trade Signals
- 26 May 2026: Long NG 07-26 @ 3.096 Signals.USAR.TR120
- 26 May 2026: Long NG 07-26 @ 3.058 Signals.USAR-WSFG
Overall Rating
- Short-Term: Neutral,
- Intermediate-Term: Bullish,
- Long-Term: Bullish.
Key Insights Summary
Natural gas is trading in a recovery structure after a sharp washout earlier in 2026, with price now back above the yearly and monthly F0%/NTZ levels and holding in the upper portion of the 2026 session grid. The weekly trend remains constructive on the fib grids, while the pivot model still shows a short-term downtrend, reflecting a mixed tape with a rebound underway rather than a fully confirmed trend reversal. Benchmarks are mostly aligned positively below price on the 5, 10, 55, and 100 day measures, while the 20 day and 200 day remain downside aligned, keeping the bigger picture transitional. The recent long signals reinforce the idea of a bounce phase with improving structure, but the chart still shows overhead resistance from prior swing highs near 4.579 to 4.866 and beyond, which frames the market as a rebuilding rally inside a larger multi-year volatility cycle.
Chart Analysis ATS AI Generated: 2026-05-26 07:05 for Informational use only, not trading advice. Terms and Risk Disclosure Copyright © 2026. Algo Trading Systems LLC.