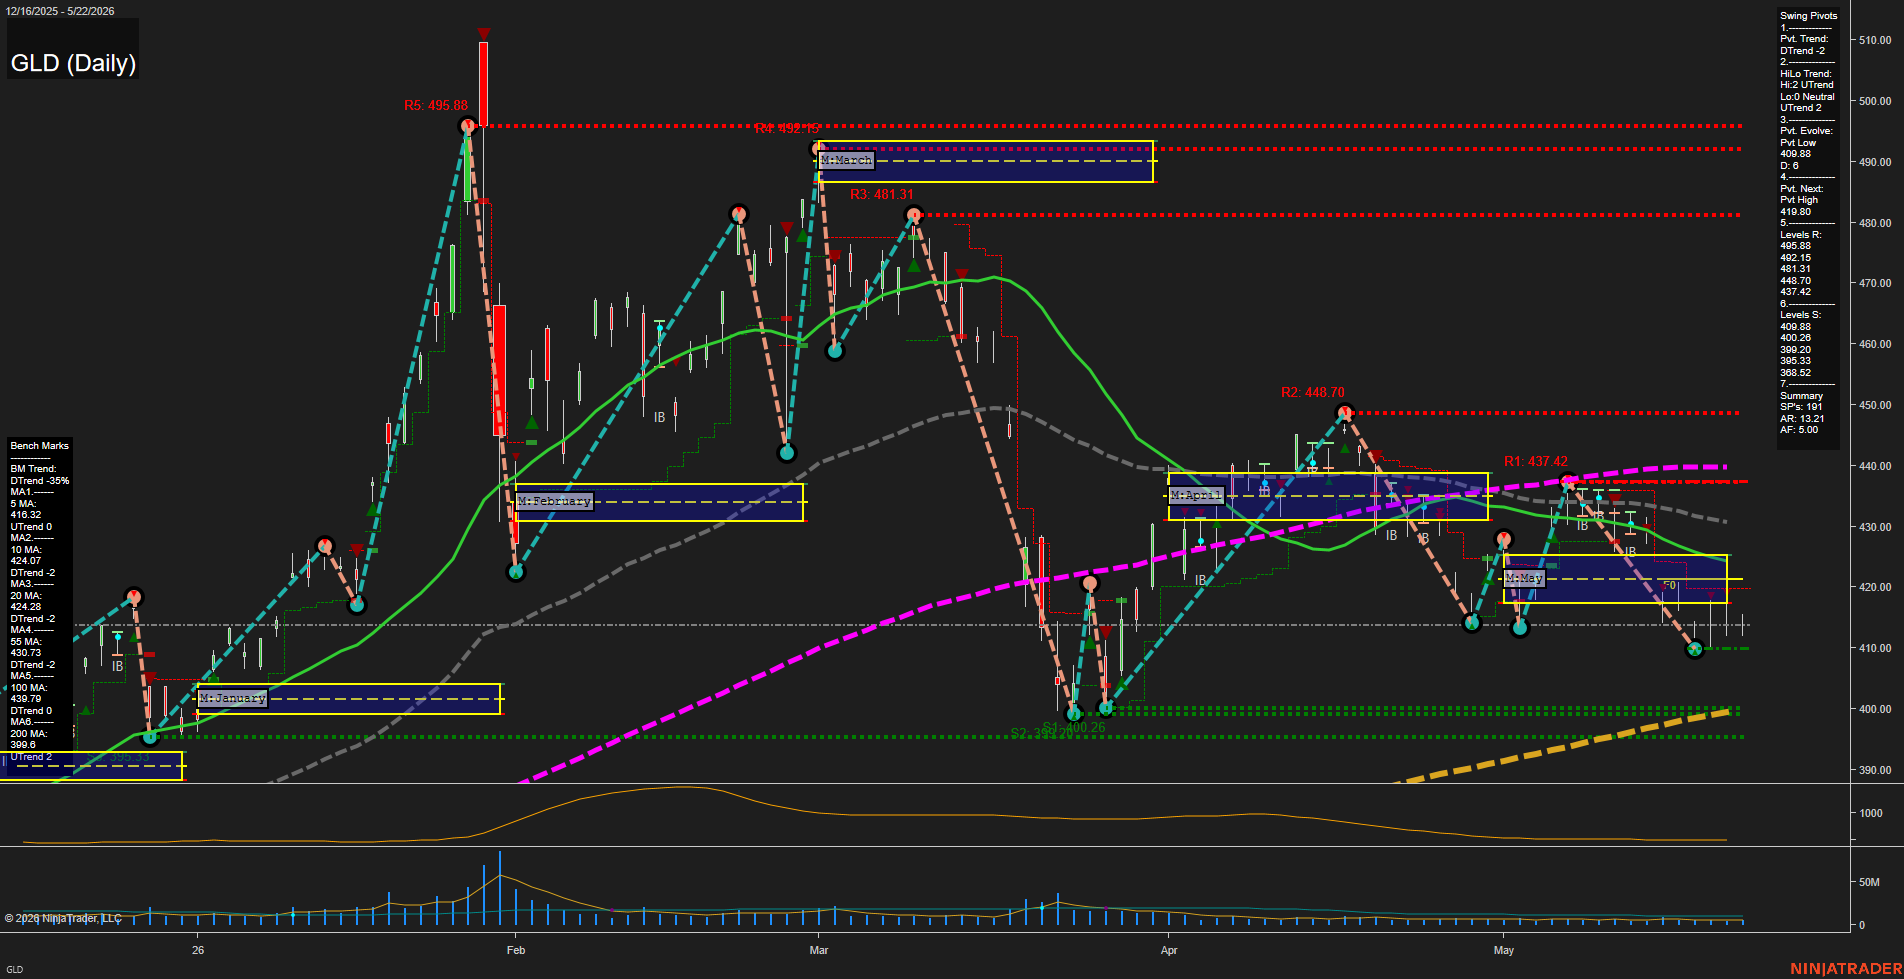
GLD SPDR Gold Shares Daily Chart Analysis: 2026-May-26 07:04 CT
Price Action
- Last: 415.00,
- Bars: Medium,
- Mom: Slow.
WSFG Weekly
- Short-Term
- WSFG Current: NA%
- F0%/NTZ' Bias: Price Neutral,
- WSFG Trend: Neutral.
MSFG Month May
- Intermediate-Term
- MSFG Current: NA%
- F0%/NTZ' Bias: Price Neutral,
- MSFG Trend: Neutral.
YSFG Year 2026
- Long-Term
- YSFG Current: NA%
- F0%/NTZ' Bias: Price Neutral,
- YSFG Trend: Neutral.
Swing Pivots
- (Short-Term) 1. Pvt. Trend: DTrend,
- (Intermediate-Term) 2. HiLo Trend: UTrend,
- 3. Pvt. Evolve: Pvt Low 409.88,
- 4. Pvt. Next: Pvt High 419.80,
- 5. Levels R: 495.88, 492.15, 481.31, 448.70, 437.42,
- 6. Levels S: 409.88, 400.28, 399.20, 385.33, 368.52.
Daily Benchmarks
- (Short-Term) 5 Day: 416.32 Up Trend,
- (Short-Term) 10 Day: 424.07 Down Trend,
- (Intermediate-Term) 20 Day: 424.28 Down Trend,
- (Intermediate-Term) 55 Day: 430.73 Down Trend,
- (Long-Term) 100 Day: 439.79 Down Trend,
- (Long-Term) 200 Day: 399.60 Up Trend.
Additional Metrics
- ATR: 13.21,
- VOLMA: 7207880.
Overall Rating
- Short-Term: Bearish,
- Intermediate-Term: Bearish,
- Long-Term: Neutral.
Key Insights Summary
GLD is trading in a corrective daily phase after the spring rally topped out near the 448.70 to 437.42 resistance zone and rolled over toward the 410 area. The short-term pivot structure remains in DTrend, with the current swing evolution pointed to a lower pivot low near 409.88 and the next reversal marker sitting at 419.80 for the opposing swing high. Price is clustered under the 10, 20, 55, and 100 day benchmarks, which keeps the intermediate trend pressured, while the 5 day remains slightly supportive and the 200 day still acts as a major long-term reference below price. The May MSFG box and its F0% area show a neutral session location, but the broader tape has a choppy, retracement-heavy feel with lower highs and repeated tests around the 415 to 420 area. From a futures swing trader viewpoint, the chart is dominated by mean-reversion and pullback behavior rather than clean trend continuation, with nearby pivot resistance overhead and layered support below.
Chart Analysis ATS AI Generated: 2026-05-26 07:04 for Informational use only, not trading advice. Terms and Risk Disclosure Copyright © 2026. Algo Trading Systems LLC.