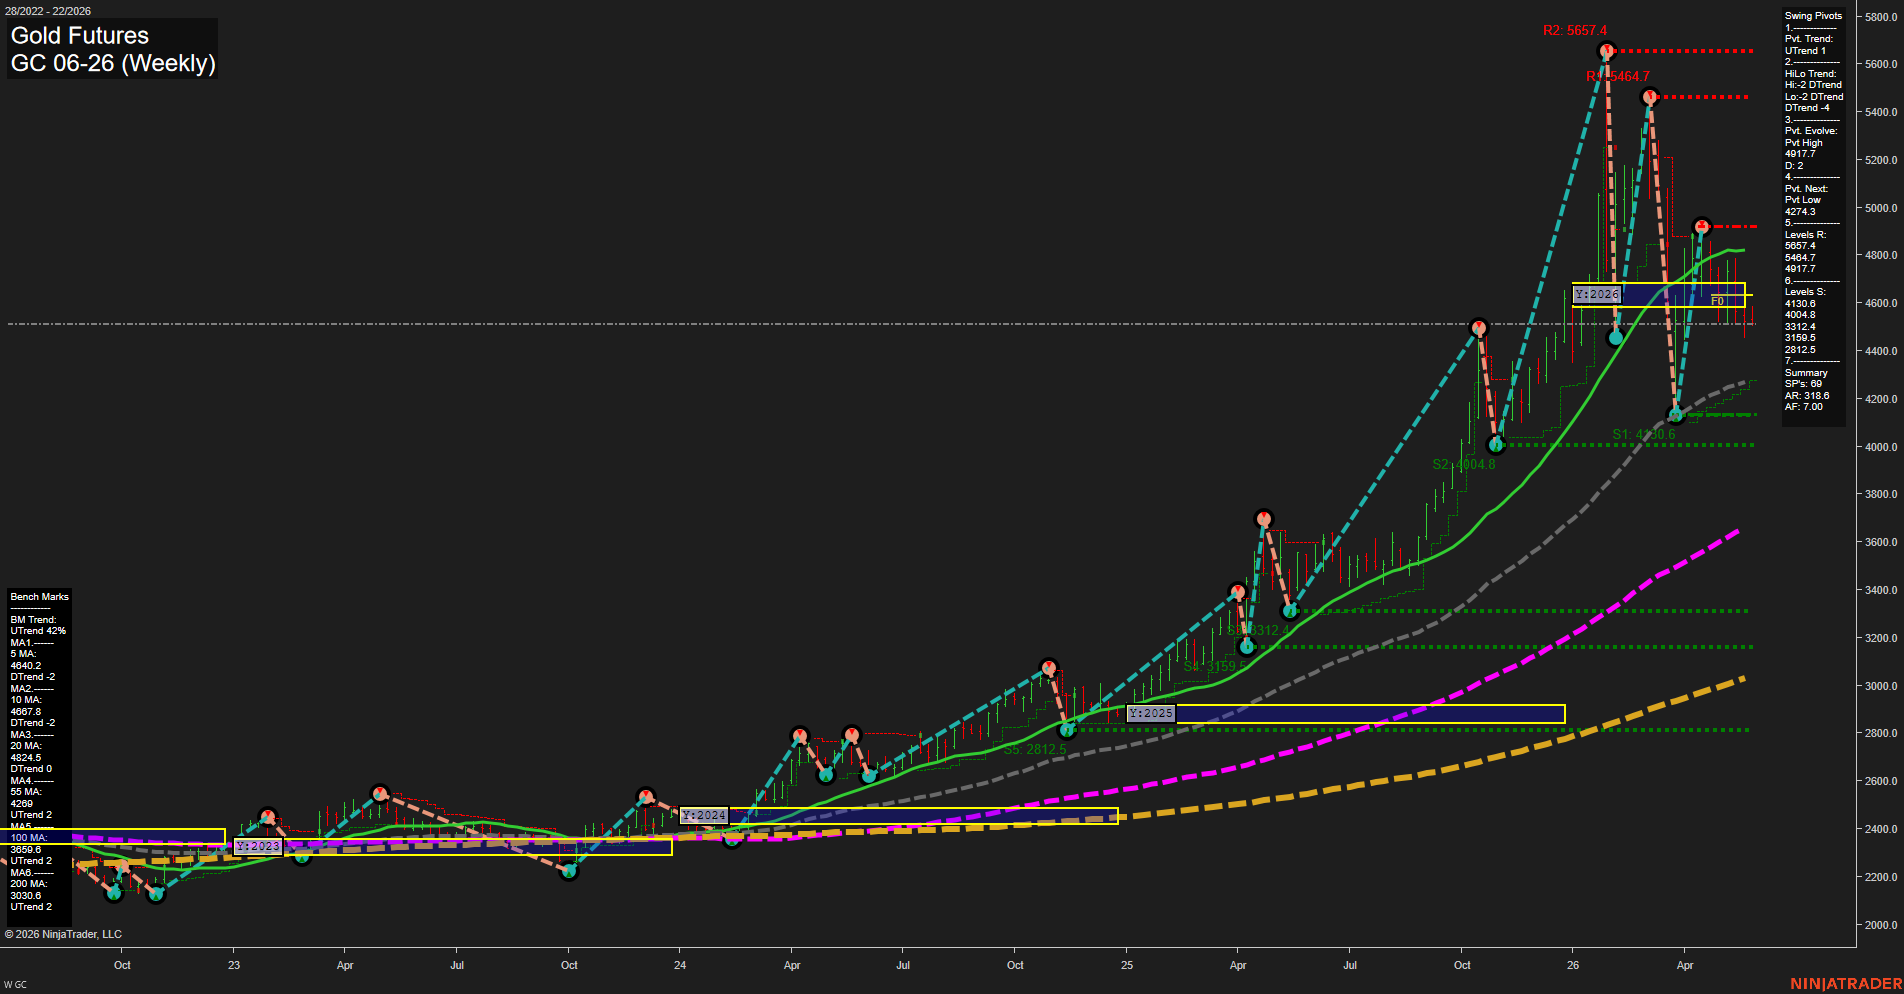
GC Gold Futures Weekly Chart Analysis: 2026-May-26 07:04 CT
Price Action
- Last: 4630,
- Bars: Large,
- Mom: fast.
WSFG Weekly
- Short-Term
- WSFG Current: -11%
- F0%/NTZ' Bias: Price Below,
- WSFG Trend: Down.
MSFG Month May
- Intermediate-Term
- MSFG Current: -15%
- F0%/NTZ' Bias: Price Below,
- MSFG Trend: Down.
YSFG Year 2026
- Long-Term
- YSFG Current: -25%
- F0%/NTZ' Bias: Price Below,
- YSFG Trend: Down.
Swing Pivots
- (Short-Term) 1. Pvt. Trend: UTrend,
- (Intermediate-Term) 2. HiLo Trend: DTrend,
- 3. Pvt. Evolve: Pvt High 4917.7,
- 4. Pvt. Next: Pvt Low 4274.3,
- 5. Levels R: 5657.4, 5464.7, 4917.7,
- 6. Levels S: 4130.6, 4004.8, 3312.4, 3159.5, 2812.5.
Weekly Benchmarks
- (Short-Term) 5 Day: 4640.2 Down Trend,
- (Short-Term) 10 Day: 4687.8 Down Trend,
- (Intermediate-Term) 20 Day: 4824.5 Down Trend,
- (Intermediate-Term) 55 Day: 4269 Up Trend,
- (Long-Term) 100 Day: 3659.6 Up Trend,
- (Long-Term) 200 Day: 3030.6 Up Trend.
Recent Trade Signals
- 25 May 2026: Long GC 06-26 @ 4563.5 Signals.USAR-WSFG
- 21 May 2026: Long GC 06-26 @ 4547.9 Signals.USAR.TR120
- 20 May 2026: Short GC 06-26 @ 4485.5 Signals.USAR-MSFG
Overall Rating
- Short-Term: Bearish,
- Intermediate-Term: Bearish,
- Long-Term: Bullish.
Key Insights Summary
Gold futures remain in a broad long-term uptrend, but the weekly structure is currently correcting from a volatile breakout-and-reversal sequence. Price is sitting below the weekly, monthly, and yearly session fib midlines, which keeps the short- and intermediate-term tone defensive and confirms downside pressure after the recent failure near the 4900s. The swing pivot structure still shows a short-term UTrend, but the intermediate-term HiLo trend is DTrend, reflecting a choppy transition phase with sharp swings between 5600, 4900, and the low 4200s. Benchmarks show price below the 5, 10, and 20-week averages, while the 55, 100, and 200-week averages remain positively aligned, preserving the larger bullish backdrop despite the current pullback. Recent signals also reflect mixed short-term rotation, with the latest WSFG and TR120 longs following an MSFG short, highlighting a fast-changing weekly tape rather than a clean directional advance.
Chart Analysis ATS AI Generated: 2026-05-26 07:04 for Informational use only, not trading advice. Terms and Risk Disclosure Copyright © 2026. Algo Trading Systems LLC.