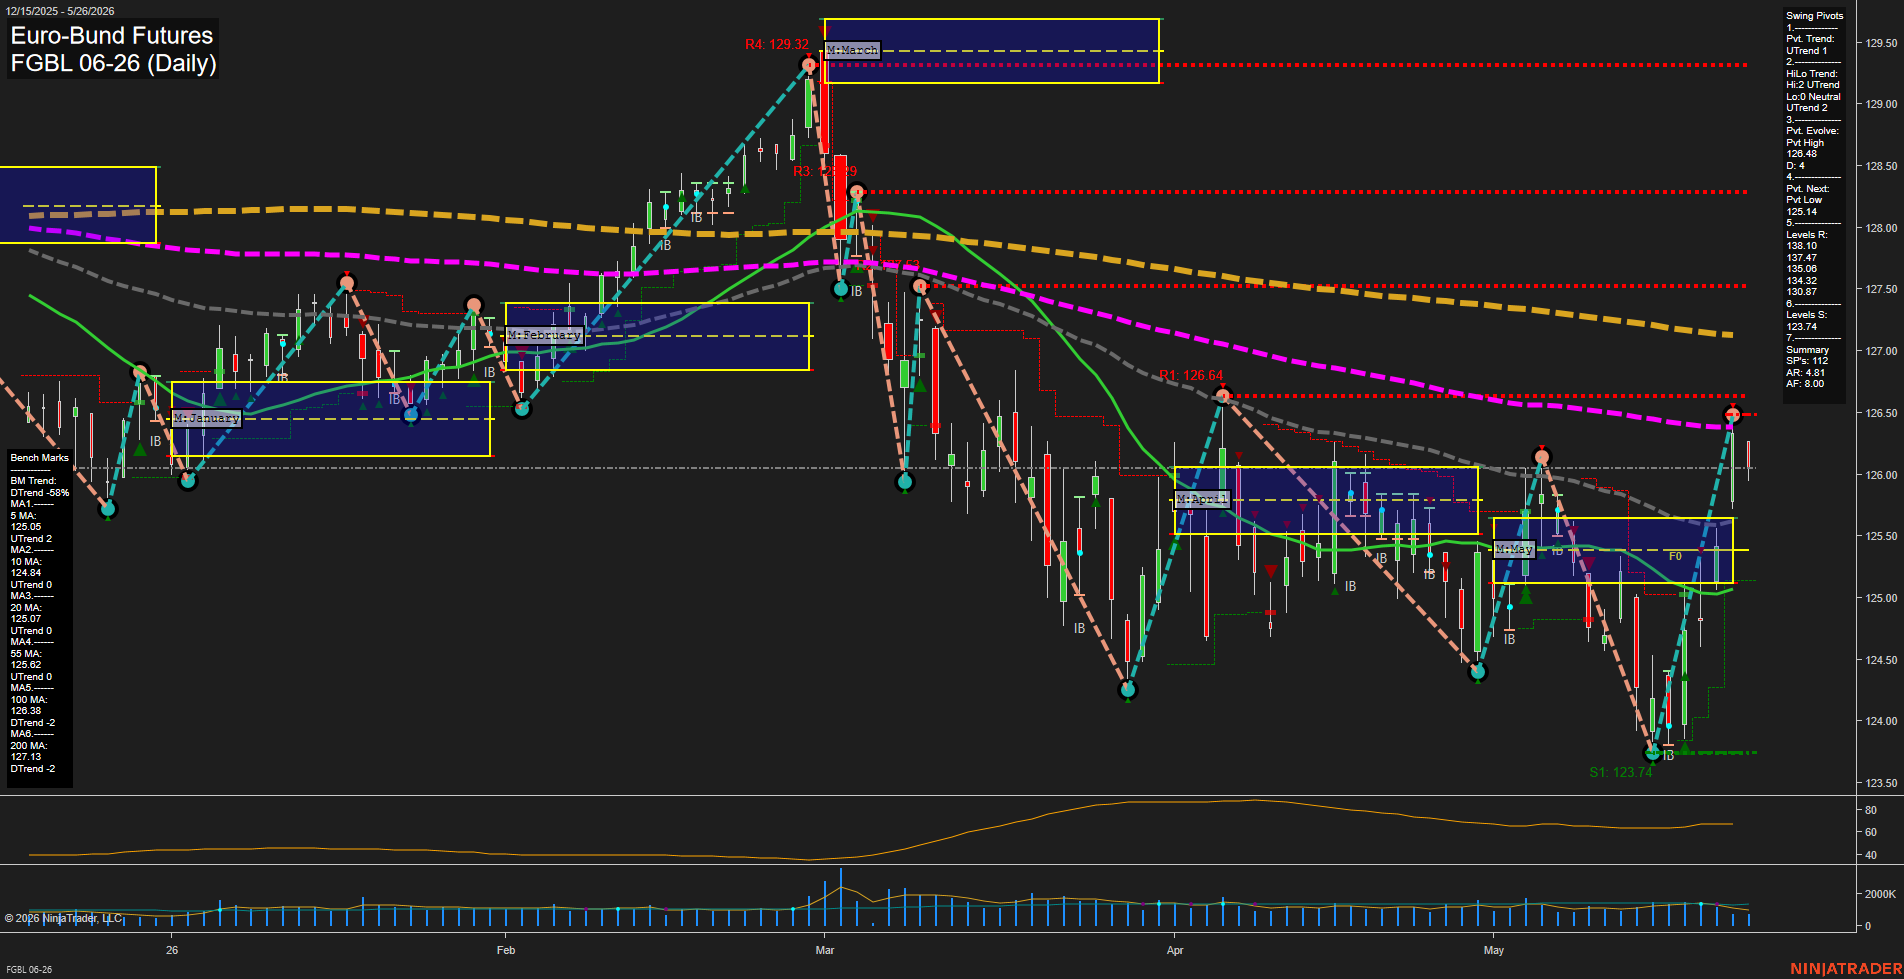
FGBL Euro-Bund Futures Daily Chart Analysis: 2026-May-26 07:03 CT
Price Action
- Last: 126.00,
- Bars: Large,
- Mom: Fast.
WSFG Weekly
- Short-Term
- WSFG Current: 16%
- F0%/NTZ' Bias: Price Above,
- WSFG Trend: Up.
MSFG Month May
- Intermediate-Term
- MSFG Current: 24%
- F0%/NTZ' Bias: Price Above,
- MSFG Trend: Up.
YSFG Year 2026
- Long-Term
- YSFG Current: -4%
- F0%/NTZ' Bias: Price Below,
- YSFG Trend: Down.
Swing Pivots
- (Short-Term) 1. Pvt. Trend: UTrend,
- (Intermediate-Term) 2. HiLo Trend: UTrend,
- 3. Pvt. Evolve: Pvt High 126.48,
- 4. Pvt. Next: Pvt Low 125.14,
- 5. Levels R: 138.10, 137.47, 135.08, 134.32, 130.87,
- 6. Levels S: 123.74.
Daily Benchmarks
- (Short-Term) 5 Day: 125.05 Up Trend,
- (Short-Term) 10 Day: 124.84 Up Trend,
- (Intermediate-Term) 20 Day: 125.07 Up Trend,
- (Intermediate-Term) 55 Day: 125.62 Up Trend,
- (Long-Term) 100 Day: 126.38 Down Trend,
- (Long-Term) 200 Day: 127.13 Down Trend.
Additional Metrics
Recent Trade Signals
- 25 May 2026: Long FGBL 06-26 @ 126.06 Signals.USAR-WSFG
- 25 May 2026: Long FGBL 06-26 @ 125.96 Signals.USAR-MSFG
- 22 May 2026: Long FGBL 06-26 @ 125.42 Signals.USAR.TR720
- 18 May 2026: Long FGBL 06-26 @ 124.32 Signals.USAR.TR120
Overall Rating
- Short-Term: Bullish,
- Intermediate-Term: Bullish,
- Long-Term: Bearish.
Key Insights Summary
Price has rebounded sharply from the early-May selloff and is now pressing back into the 126 area after a strong upside reversal from the 123.74 swing support. Short-term structure is constructive with the pivot trend in UTrend, the weekly and monthly session fib grids both holding above their F0% centers, and recent trade signals confirming upside continuation from the 124.32 to 126.06 sequence. Intermediate-term structure remains positive as price has recovered back above the 20 and 55 day benchmarks, but the broader tape is still capped by the declining 100 and 200 day averages overhead, keeping the long-term posture defensive. The broader pattern is a rally into a mid-range resistance zone after a deep retracement, with volatility elevated and momentum firm, while the higher time-frame trend remains below the year’s session bias.
Chart Analysis ATS AI Generated: 2026-05-26 07:03 for Informational use only, not trading advice. Terms and Risk Disclosure Copyright © 2026. Algo Trading Systems LLC.