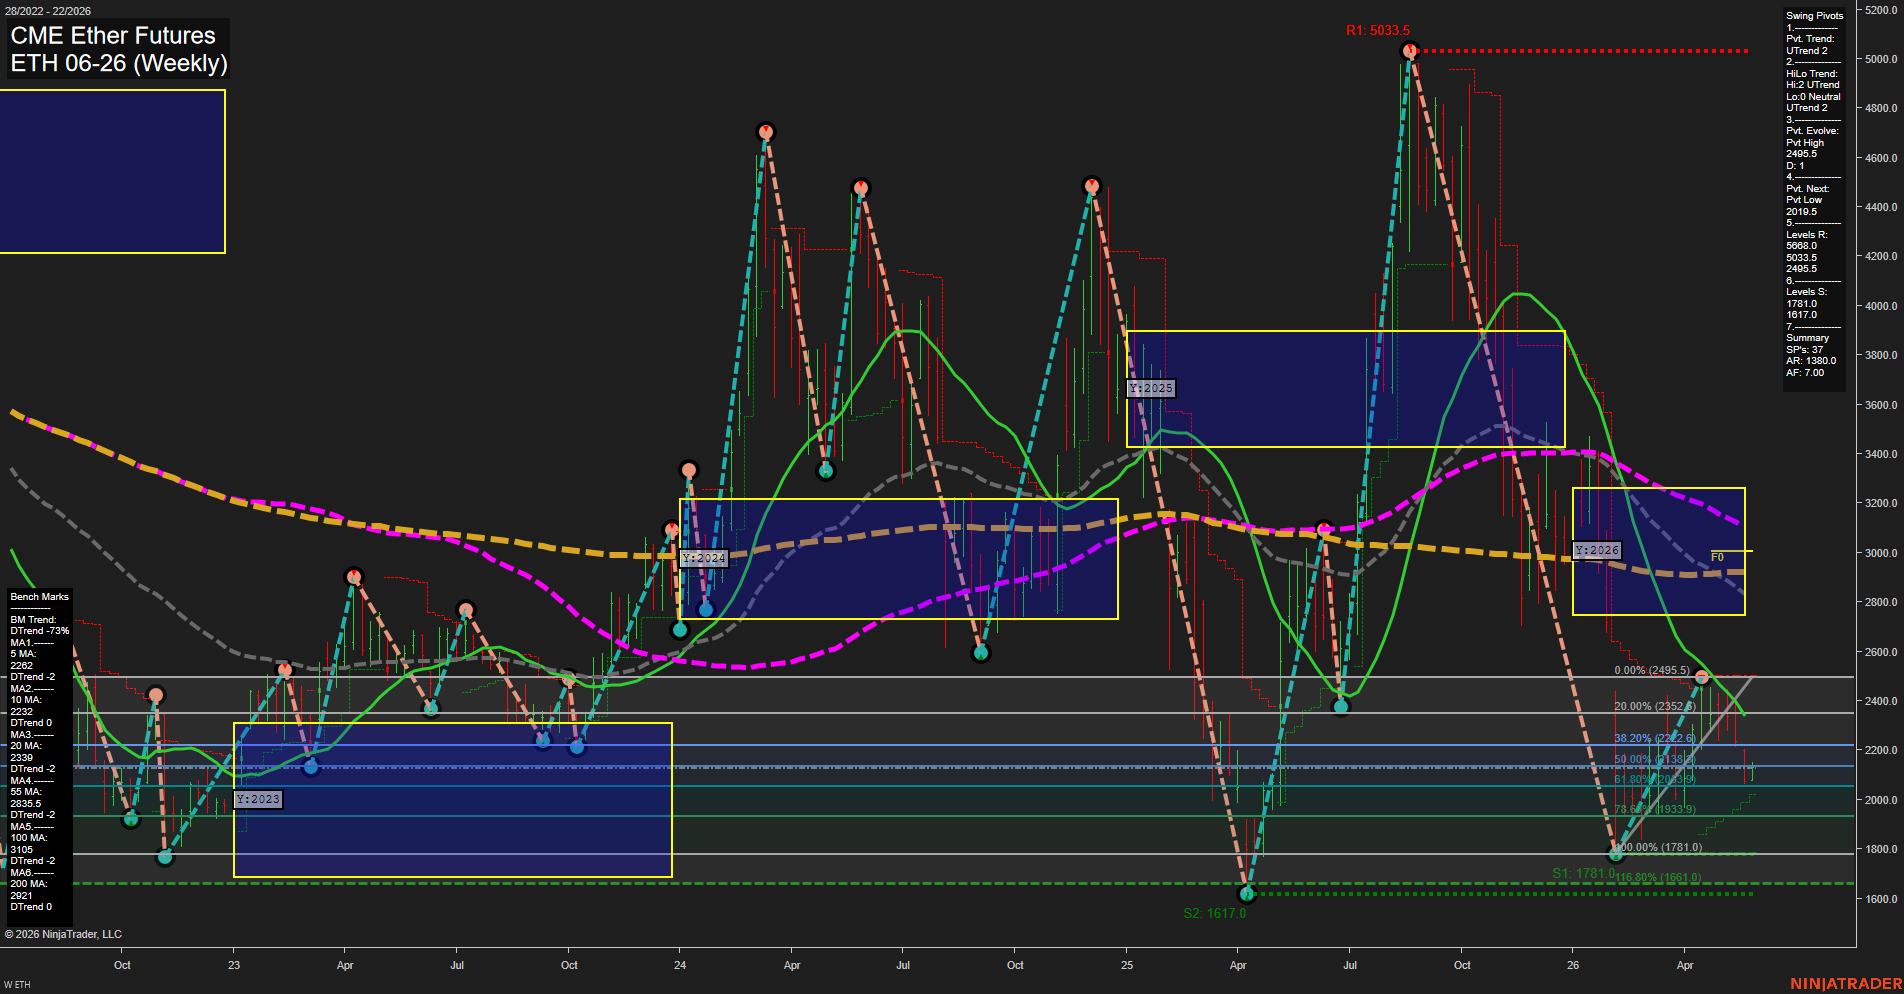
ETH CME Ether Futures Weekly Chart Analysis: 2026-May-26 07:03 CT
Price Action
- Last: 2170.0,
- Bars: Large,
- Mom: fast.
WSFG Weekly
- Short-Term
- WSFG Current: 37%
- F0%/NTZ' Bias: Price Above,
- WSFG Trend: Up.
MSFG Month May
- Intermediate-Term
- MSFG Current: -33%
- F0%/NTZ' Bias: Price Below,
- MSFG Trend: Down.
YSFG Year 2026
- Long-Term
- YSFG Current: -34%
- F0%/NTZ' Bias: Price Below,
- YSFG Trend: Down.
Swing Pivots
- (Short-Term) 1. Pvt. Trend: UTrend,
- (Intermediate-Term) 2. HiLo Trend: UTrend,
- 3. Pvt. Evolve: Pvt High 2495.5,
- 4. Pvt. Next: Pvt Low 2019.5,
- 5. Levels R: 5688.0, 5033.5, 2495.5,
- 6. Levels S: 1781.0, 1617.0.
Weekly Benchmarks
- (Short-Term) 5 Day: 2262 Down Trend,
- (Short-Term) 10 Day: 2232 Down Trend,
- (Intermediate-Term) 20 Day: 2339 Down Trend,
- (Intermediate-Term) 55 Day: 2835.5 Down Trend,
- (Long-Term) 100 Day: 3105 Down Trend,
- (Long-Term) 200 Day: 2921 Down Trend.
Overall Rating
- Short-Term: Neutral,
- Intermediate-Term: Bearish,
- Long-Term: Bearish.
Key Insights Summary
Weekly ETH futures are trading in a volatile, swing-heavy structure with a sharp contraction from the 2025 peak near 5033.5 and a broad sequence of lower highs from that major top. The current weekly candle sits well below the 20-, 55-, 100-, and 200-day benchmarks, showing that the broader tape remains technically weak even though the short-term swing pivot trend has flipped back to UTrend. The weekly fib grid is still holding above its center bias, which supports a near-term rebound tone, but the monthly and yearly session grids remain below their F0% levels, keeping the intermediate and long-term structure under pressure. The market has spent the recent phase in a lower-price retracement band between the 20% and 61.8% zones, with frequent test-and-reject behavior and a choppy, rotational feel rather than a clean trend. Overall, the chart reflects a market that is still digesting the prior selloff while attempting to stabilize inside a broader bearish framework.
Chart Analysis ATS AI Generated: 2026-05-26 07:03 for Informational use only, not trading advice. Terms and Risk Disclosure Copyright © 2026. Algo Trading Systems LLC.