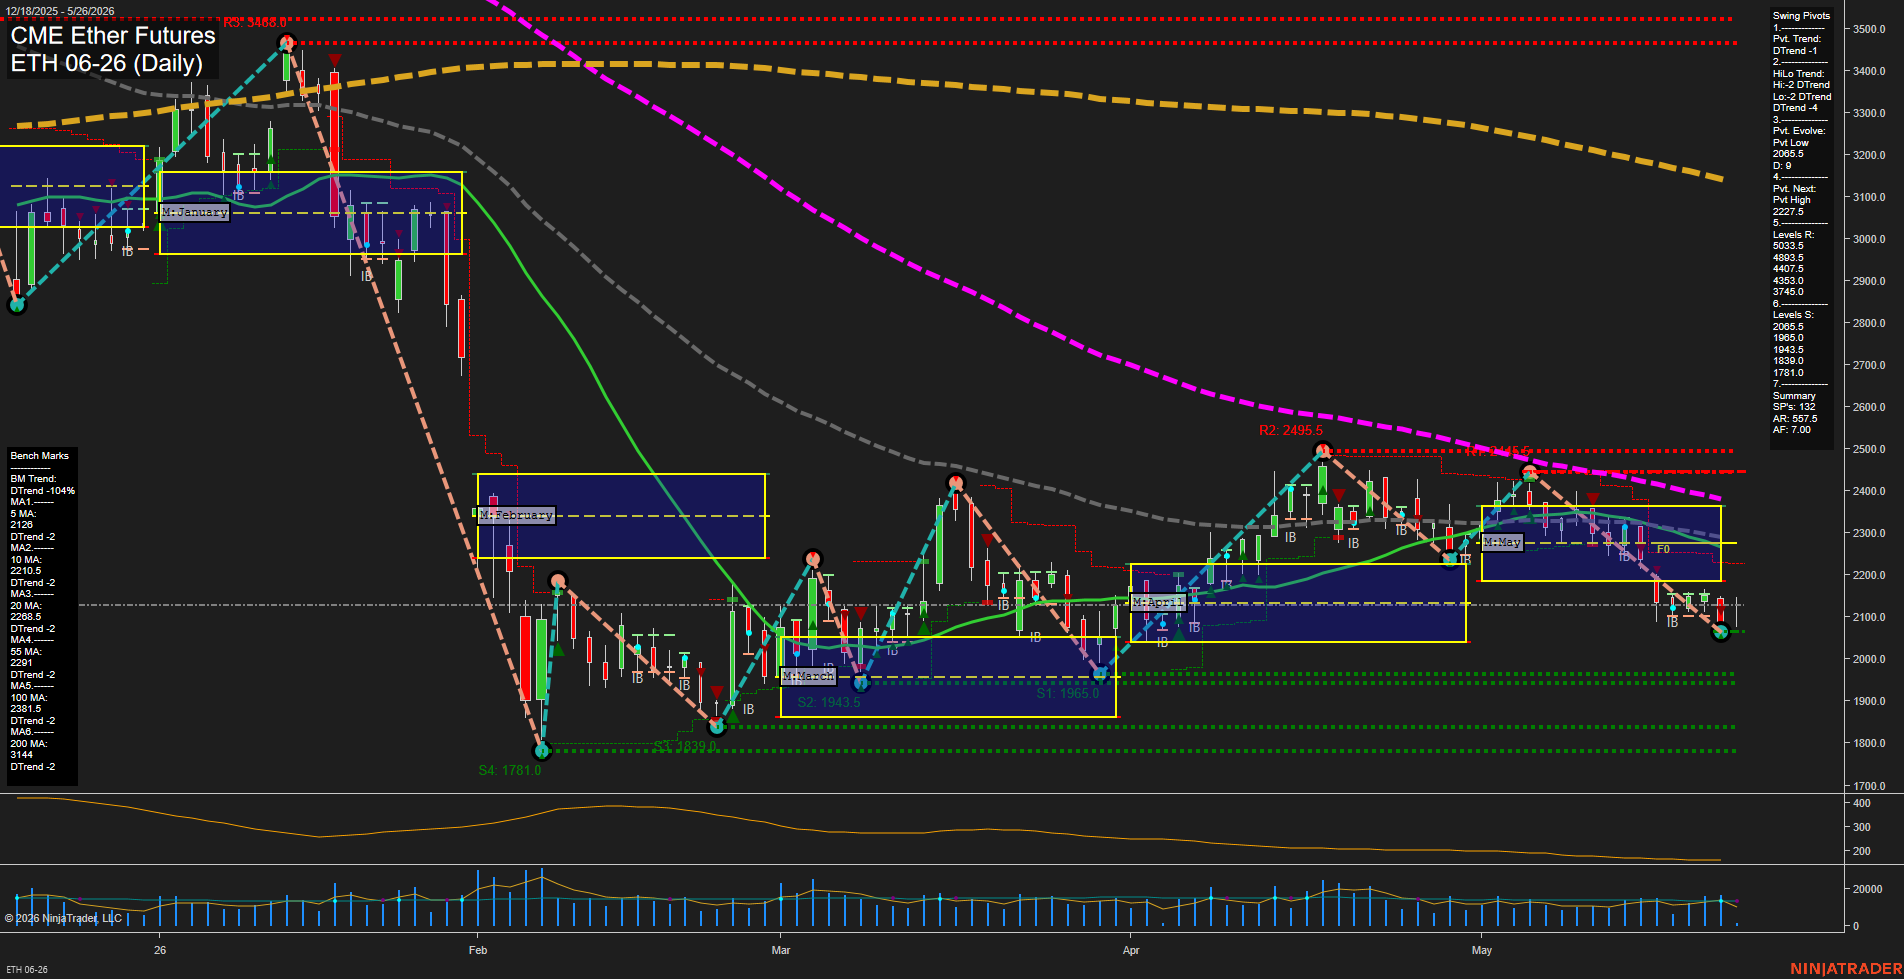
ETH CME Ether Futures Daily Chart Analysis: 2026-May-26 07:03 CT
Price Action
- Last: 2088,
- Bars: Large,
- Mom: Slow.
WSFG Weekly
- Short-Term
- WSFG Current: 37%
- F0%/NTZ' Bias: Price Above,
- WSFG Trend: Up.
MSFG Month May
- Intermediate-Term
- MSFG Current: -33%
- F0%/NTZ' Bias: Price Below,
- MSFG Trend: Down.
YSFG Year 2026
- Long-Term
- YSFG Current: -34%
- F0%/NTZ' Bias: Price Below,
- YSFG Trend: Down.
Swing Pivots
- (Short-Term) 1. Pvt. Trend: DTrend,
- (Intermediate-Term) 2. HiLo Trend: DTrend,
- 3. Pvt. Evolve: Pvt Low 2065.5,
- 4. Pvt. Next: Pvt High 2222.5,
- 5. Levels R: 5033.5, 4893.5, 4407.5, 4353.0, 3744.0,
- 6. Levels S: 2065.5, 1965.0, 1943.5, 1839.0, 1781.0.
Daily Benchmarks
- (Short-Term) 5 Day: 2126 Down Trend,
- (Short-Term) 10 Day: 2210.5 Down Trend,
- (Intermediate-Term) 20 Day: 2268.5 Down Trend,
- (Intermediate-Term) 55 Day: 2291 Down Trend,
- (Long-Term) 100 Day: 2381.5 Down Trend,
- (Long-Term) 200 Day: 3144 Down Trend.
Additional Metrics
Overall Rating
- Short-Term: Bearish,
- Intermediate-Term: Bearish,
- Long-Term: Bearish.
Key Insights Summary
ETH CME futures are trading in a broad corrective downtrend with price pressing below the entire benchmark MA stack and remaining under the May session Fib midpoint. The daily structure shows lower highs and lower lows, with the swing pivot framework still in DTrend and the next pivot context pointing to a potential upside pivot only after a confirmed reversal from the current low sequence. Weekly structure remains constructive above its NTZ, but the monthly and yearly grids stay below F0%, keeping the larger swing picture aligned to the downside. Overhead, the first meaningful resistance zone is clustered around the 5/10/20/55-day averages near 2126 to 2291, while the nearest downside reference sits at the 2065.5, 1965.0, and 1943.5 pivot support band. The recent price behavior reflects a sold-off retracement phase after earlier spring rallies, with volatility still elevated but momentum moderating as the market compresses near support.
Chart Analysis ATS AI Generated: 2026-05-26 07:03 for Informational use only, not trading advice. Terms and Risk Disclosure Copyright © 2026. Algo Trading Systems LLC.