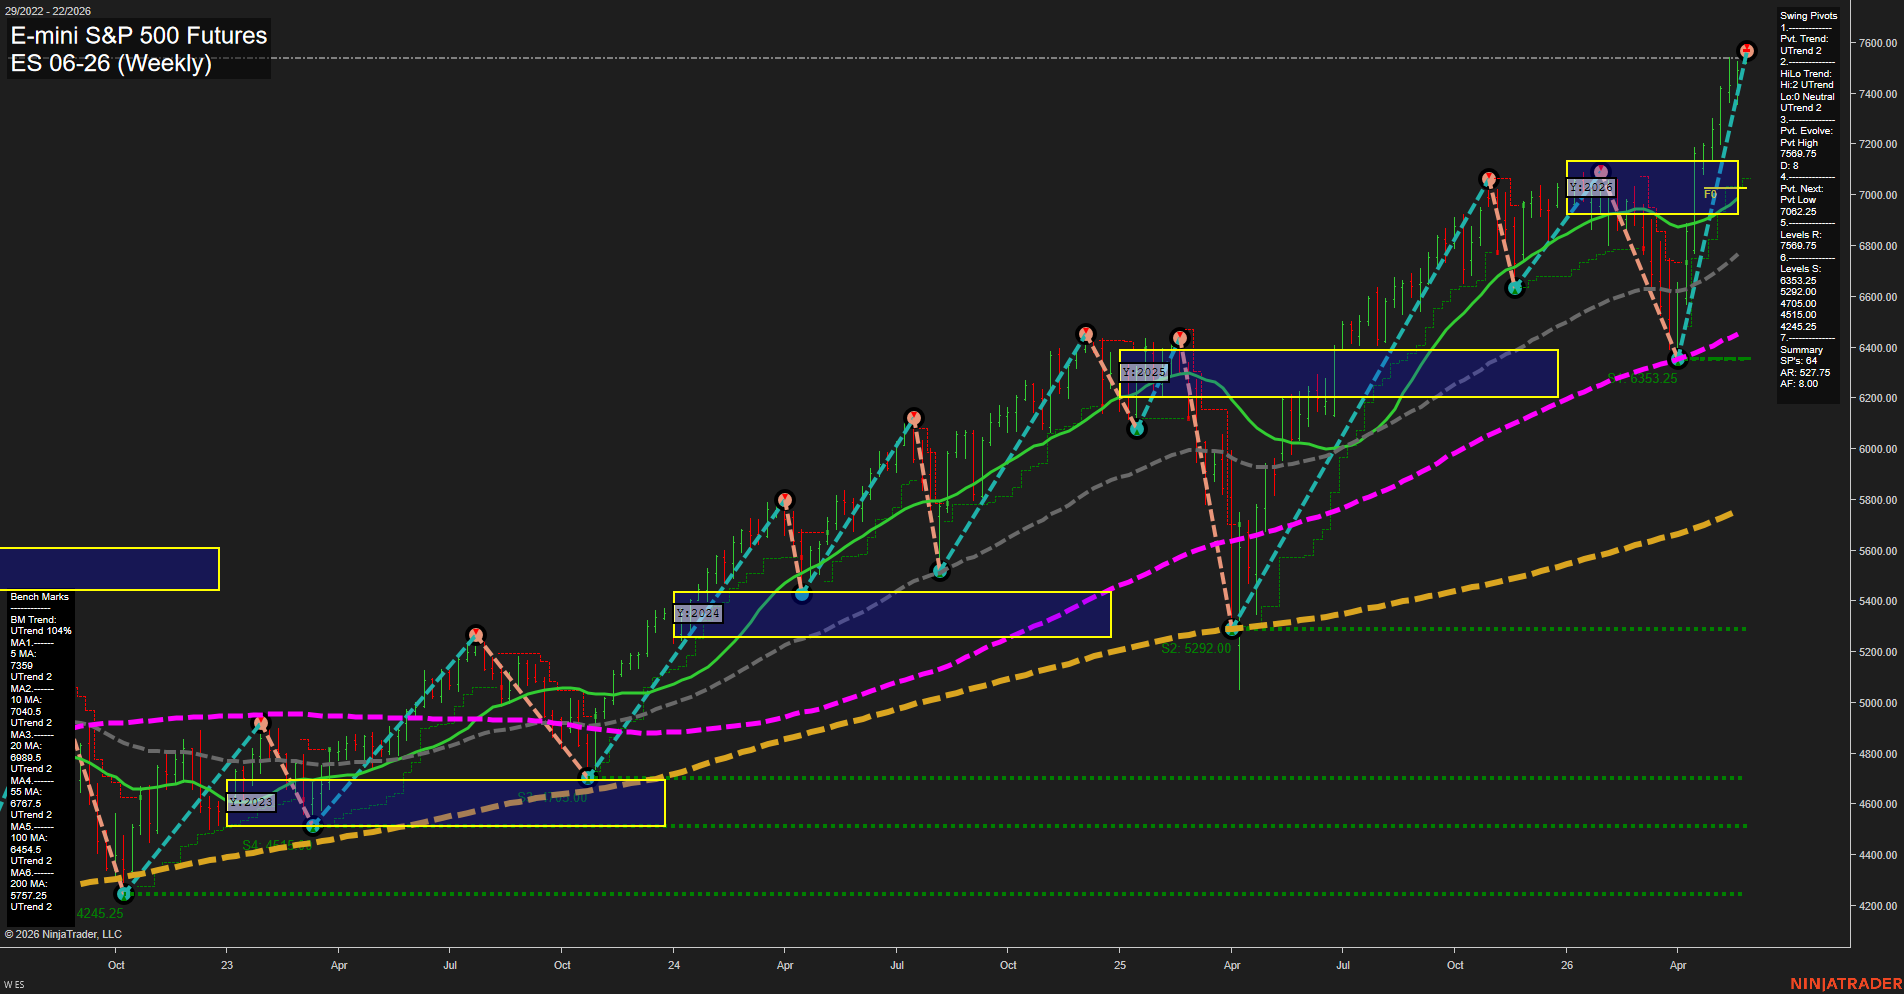
ES E-mini S&P 500 Futures Weekly Chart Analysis: 2026-May-26 07:03 CT
Price Action
- Last: 7569.75,
- Bars: Large,
- Mom: Fast.
WSFG Weekly
- Short-Term
- WSFG Current: 11%
- F0%/NTZ' Bias: Price Above,
- WSFG Trend: Up.
MSFG Month May
- Intermediate-Term
- MSFG Current: 63%
- F0%/NTZ' Bias: Price Above,
- MSFG Trend: Up.
YSFG Year 2026
- Long-Term
- YSFG Current: 49%
- F0%/NTZ' Bias: Price Above,
- YSFG Trend: Up.
Swing Pivots
- (Short-Term) 1. Pvt. Trend: UTrend,
- (Intermediate-Term) 2. HiLo Trend: UTrend,
- 3. Pvt. Evolve: Pvt High 7569.75,
- 4. Pvt. Next: Pvt Low 7062.25,
- 5. Levels R: 7569.75,
- 6. Levels S: 6353.25, 5292.00, 4705.00, 4515.00, 4245.25.
Weekly Benchmarks
- (Short-Term) 5 Day: 7359 Up Trend,
- (Short-Term) 10 Day: 7040.5 Up Trend,
- (Intermediate-Term) 20 Day: 6898.5 Up Trend,
- (Intermediate-Term) 55 Day: 6767.5 Up Trend,
- (Long-Term) 100 Day: 6454.5 Up Trend,
- (Long-Term) 200 Day: 5757.25 Up Trend.
Recent Trade Signals
- 26 May 2026: Long ES 06-26 @ 7539.75 Signals.USAR-WSFG
- 20 May 2026: Long ES 06-26 @ 7451.5 Signals.USAR.TR120
Overall Rating
- Short-Term: Bullish,
- Intermediate-Term: Bullish,
- Long-Term: Bullish.
Key Insights Summary
Weekly ES is in a strong upside expansion with price at fresh highs and momentum accelerating. The pivot structure remains firmly in UTrend, with higher highs and higher lows intact across the weekly swing map. All benchmark moving averages are stacked in bullish alignment, confirming broad trend support from short through long term. WSFG is still in the early portion of its cycle, while the monthly and yearly grids remain above their F0% centers, reinforcing trend continuation rather than reversal behavior. The chart shows a mature but still active bullish sequence, with recent breakout strength carrying price above the prior resistance zone and into new territory.
Chart Analysis ATS AI Generated: 2026-05-26 07:03 for Informational use only, not trading advice. Terms and Risk Disclosure Copyright © 2026. Algo Trading Systems LLC.