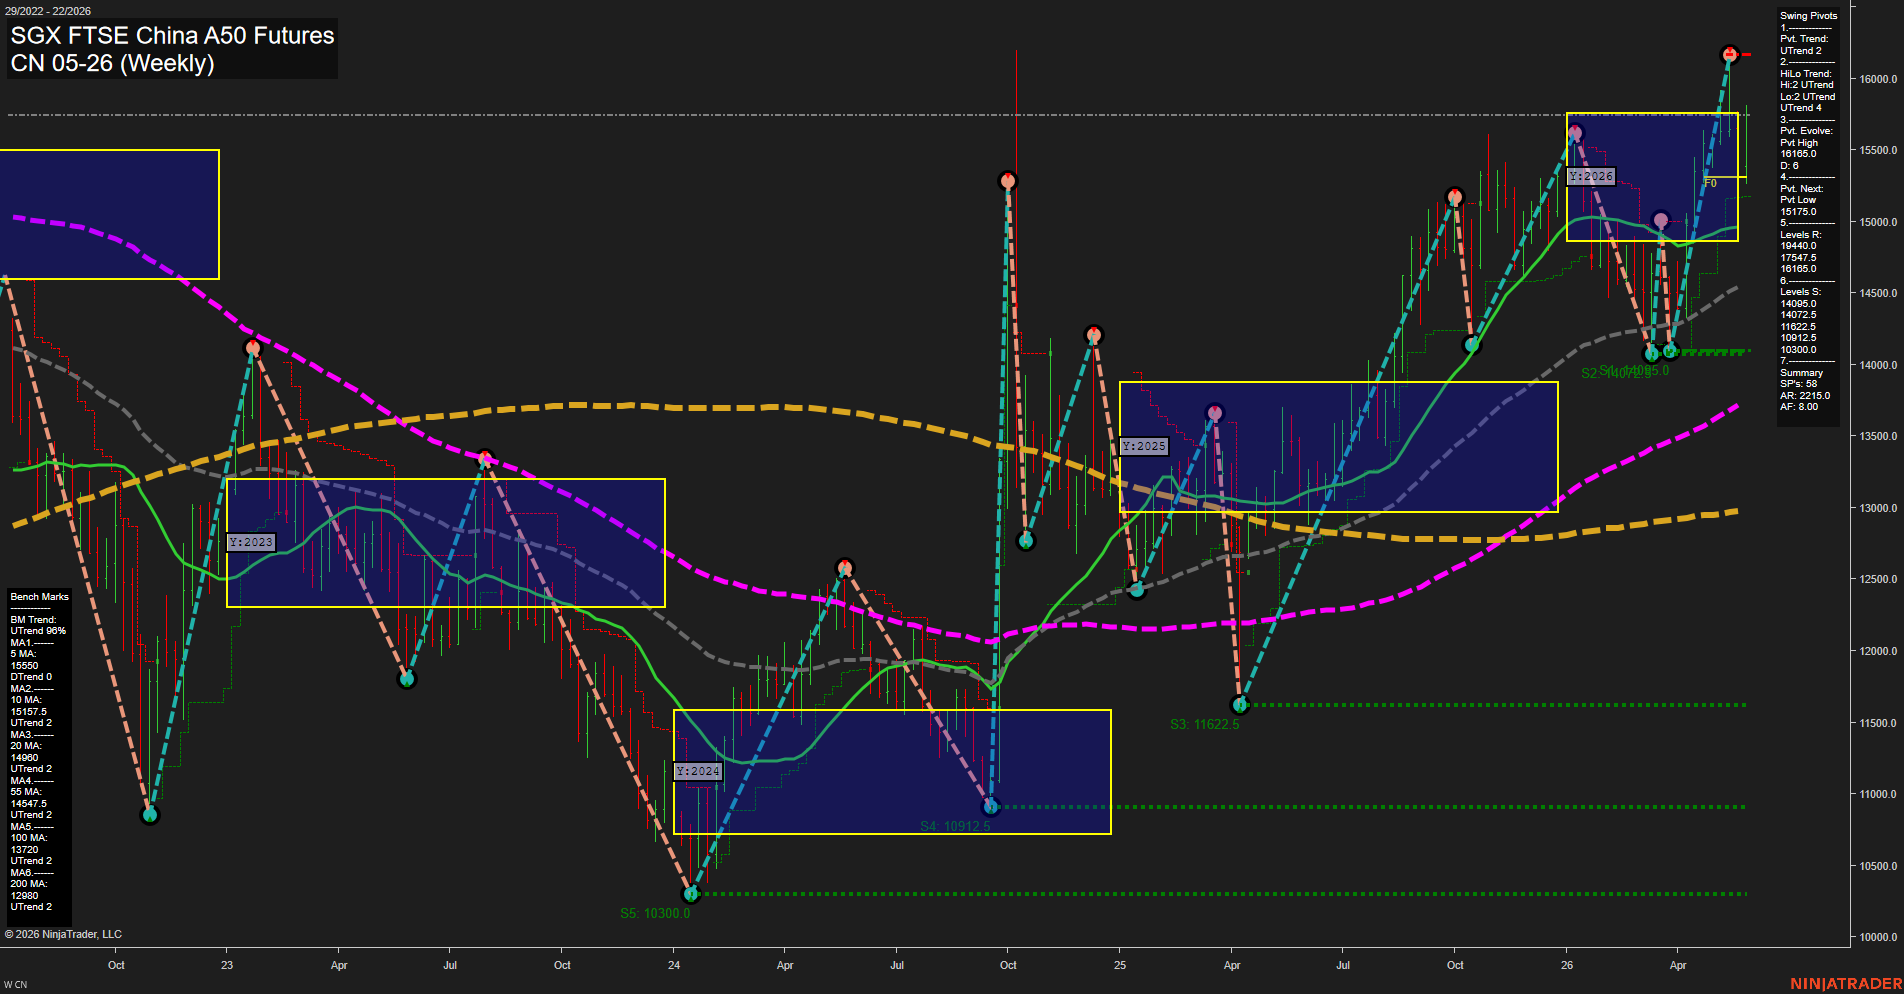
CN SGX FTSE China A50 Futures Weekly Chart Analysis: 2026-May-26 07:02 CT
Price Action
- Last: 16160.0,
- Bars: Large,
- Mom: Fast.
WSFG Weekly
- Short-Term
- WSFG Current: NA%
- F0%/NTZ' Bias: Price Neutral,
- WSFG Trend: Neutral.
MSFG Month May
- Intermediate-Term
- MSFG Current: NA%
- F0%/NTZ' Bias: Price Neutral,
- MSFG Trend: Neutral.
YSFG Year 2026
- Long-Term
- YSFG Current: NA%
- F0%/NTZ' Bias: Price Neutral,
- YSFG Trend: Neutral.
Swing Pivots
- (Short-Term) 1. Pvt. Trend: UTrend,
- (Intermediate-Term) 2. HiLo Trend: UTrend,
- 3. Pvt. Evolve: Pvt High 16165.0,
- 4. Pvt. Next: Pvt Low 15175.0,
- 5. Levels R: 19440.0, 17547.5, 16165.0,
- 6. Levels S: 14095.0, 14072.5, 11622.5, 10912.5, 10300.0.
Weekly Benchmarks
- (Short-Term) 5 Day: 15550.0 Up Trend,
- (Short-Term) 10 Day: 15157.5 Up Trend,
- (Intermediate-Term) 20 Day: 14960.0 Up Trend,
- (Intermediate-Term) 55 Day: 14547.5 Up Trend,
- (Long-Term) 100 Day: 13720.0 Up Trend,
- (Long-Term) 200 Day: 12880.0 Up Trend.
Overall Rating
- Short-Term: Bullish,
- Intermediate-Term: Bullish,
- Long-Term: Bullish.
Key Insights Summary
The weekly structure remains firmly constructive, with price pushing into fresh highs near 16,160 after a strong multi-month advance from the 2024 base and the 2025 recovery phase. Swing pivots show an active UTrend on both the short-term pivot and the broader HiLo trend, confirming higher highs and higher lows. Price is trading well above all benchmark moving averages, and every listed benchmark remains in up trend alignment, which supports a bullish swing-trend backdrop across short, intermediate, and long horizons. The chart is in an expansion phase after the prior consolidation and breakout sequence, with momentum accelerating into the upper yearly session zone. Nearby resistance is clustered at the recent pivot high and the higher historical levels above it, while support steps down through the prior pivot shelves and the rising benchmark stack. Overall, the chart reflects a strong trend continuation profile with the dominant theme being upward trend persistence rather than mean reversion.
Chart Analysis ATS AI Generated: 2026-05-26 07:02 for Informational use only, not trading advice. Terms and Risk Disclosure Copyright © 2026. Algo Trading Systems LLC.