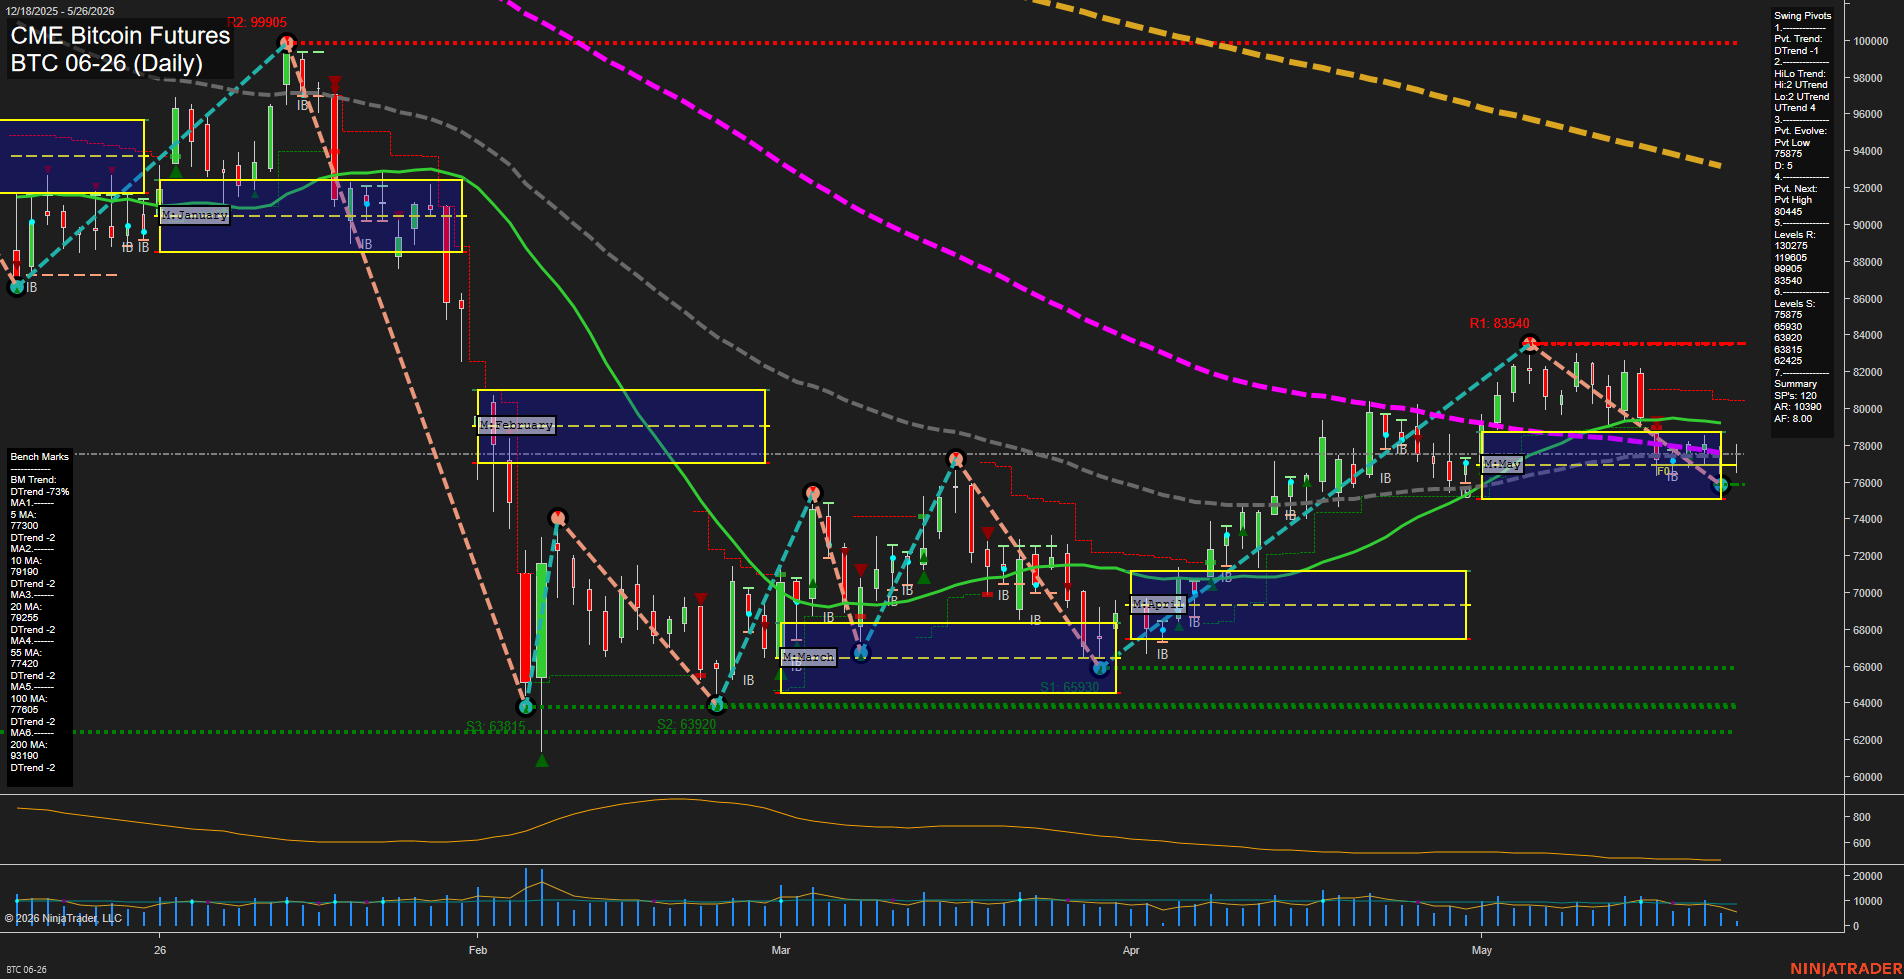
BTC CME Bitcoin Futures Daily Chart Analysis: 2026-May-26 07:01 CT
Price Action
- Last: 75815,
- Bars: Medium,
- Mom: Slow.
WSFG Weekly
- Short-Term
- WSFG Current: 21%
- F0%/NTZ' Bias: Price Above,
- WSFG Trend: Up.
MSFG Month May
- Intermediate-Term
- MSFG Current: -3%
- F0%/NTZ' Bias: Price Below,
- MSFG Trend: Down.
YSFG Year 2026
- Long-Term
- YSFG Current: -43%
- F0%/NTZ' Bias: Price Below,
- YSFG Trend: Down.
Swing Pivots
- (Short-Term) 1. Pvt. Trend: DTrend,
- (Intermediate-Term) 2. HiLo Trend: UTrend,
- 3. Pvt. Evolve: Pvt Low 75835,
- 4. Pvt. Next: Pvt High 80445,
- 5. Levels R: 130275, 119605, 99905, 83540,
- 6. Levels S: 75875, 65930, 63920, 63815, 62425.
Daily Benchmarks
- (Short-Term) 5 Day: 77330 Down Trend,
- (Short-Term) 10 Day: 79190 Down Trend,
- (Intermediate-Term) 20 Day: 79255 Down Trend,
- (Intermediate-Term) 55 Day: 77420 Down Trend,
- (Long-Term) 100 Day: 77605 Down Trend,
- (Long-Term) 200 Day: 93190 Down Trend.
Additional Metrics
Recent Trade Signals
- 22 May 2026: Short BTC 05-26 @ 75815 Signals.USAR-MSFG
- 21 May 2026: Short BTC 05-26 @ 77355 Signals.USAR-WSFG
- 18 May 2026: Short BTC 05-26 @ 76390 Signals.USAR.TR720
Overall Rating
- Short-Term: Bearish,
- Intermediate-Term: Bearish,
- Long-Term: Bearish.
Key Insights Summary
Price action is sitting near the lower edge of the May session structure after failing to hold the mid- to upper-80k recovery zone, with the latest swing sequence showing a lower-high rejection from the 83,540 resistance area and a drift back toward the 75,835 pivot low. The short-term pivot trend is down while the broader hi/lo structure remains constructive but capped by overhead resistance, creating a mixed swing profile that has rolled back into weakness. All benchmark moving averages are sloping down and price is below the 5, 10, 20, 55, 100, and 200 day references, confirming a bearish alignment across timeframes. Weekly structure remains positive above its fib bias, but the monthly and yearly session grids are both below their NTZ/F0% centers and pointing down, which keeps the larger bias heavy. Recent short signals from TR720, WSFG, and MSFG align with the current bearish tape, and the chart reflects a choppy recovery attempt that lost momentum into a retracement and rejection phase.
Chart Analysis ATS AI Generated: 2026-05-26 07:01 for Informational use only, not trading advice. Terms and Risk Disclosure Copyright © 2026. Algo Trading Systems LLC.