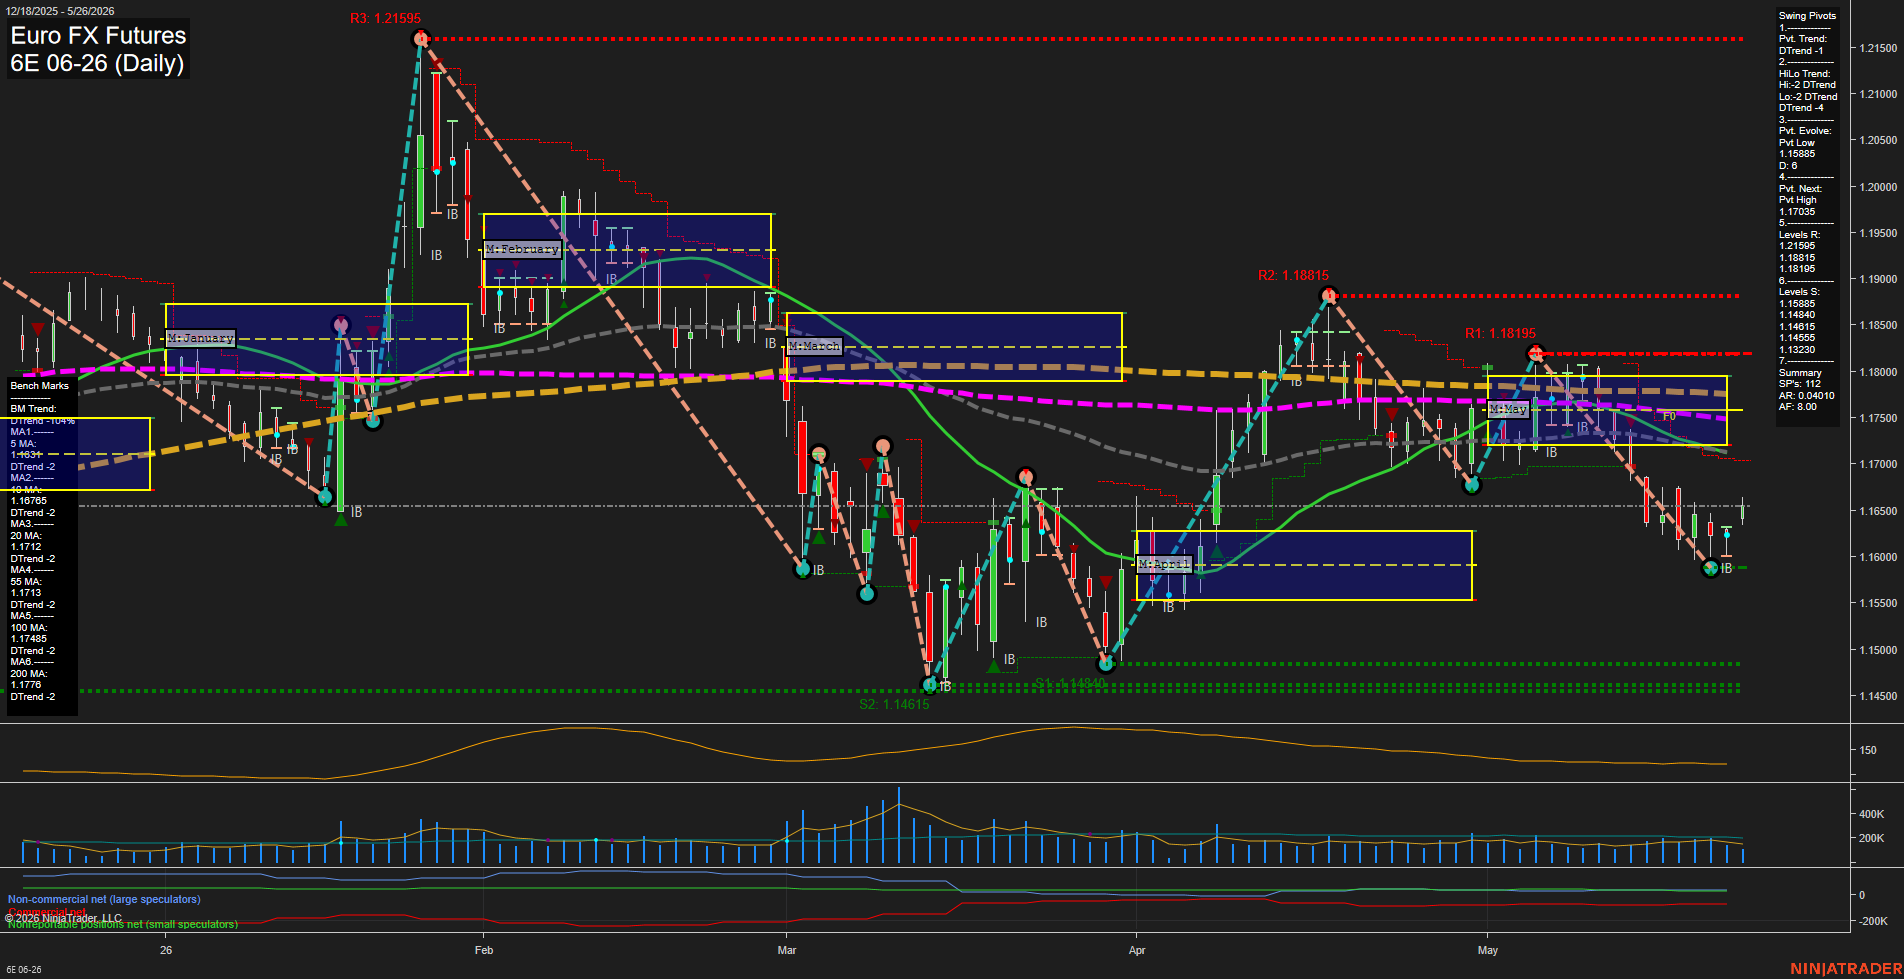
6E Euro FX Futures Daily Chart Analysis: 2026-May-26 07:00 CT
Price Action
- Last: 1.1655,
- Bars: Medium,
- Mom: average.
WSFG Weekly
- Short-Term
- WSFG Current: 4%
- F0%/NTZ' Bias: Price Above,
- WSFG Trend: Up.
MSFG Month May
- Intermediate-Term
- MSFG Current: -37%
- F0%/NTZ' Bias: Price Below,
- MSFG Trend: Down.
YSFG Year 2026
- Long-Term
- YSFG Current: -16%
- F0%/NTZ' Bias: Price Below,
- YSFG Trend: Down.
Swing Pivots
- (Short-Term) 1. Pvt. Trend: DTrend,
- (Intermediate-Term) 2. HiLo Trend: DTrend,
- 3. Pvt. Evolve: Pvt Low 1.15885,
- 4. Pvt. Next: Pvt High 1.17035,
- 5. Levels R: 1.21595, 1.18815, 1.18195,
- 6. Levels S: 1.15885, 1.14840, 1.14615.
Daily Benchmarks
- (Short-Term) 5 Day: 1.16391 Down Trend,
- (Short-Term) 10 Day: 1.16785 Down Trend,
- (Intermediate-Term) 20 Day: 1.17120 Down Trend,
- (Intermediate-Term) 55 Day: 1.17130 Down Trend,
- (Long-Term) 100 Day: 1.17485 Down Trend,
- (Long-Term) 200 Day: 1.17780 Down Trend.
Additional Metrics
Recent Trade Signals
- 26 May 2026: Long 6E 06-26 @ 1.1654 Signals.USAR-WSFG
- 25 May 2026: Long 6E 06-26 @ 1.1653 Signals.USAR.TR120
Overall Rating
- Short-Term: Neutral,
- Intermediate-Term: Bearish,
- Long-Term: Bearish.
Key Insights Summary
Daily price action remains in a broader downtrend structure with the market trading below the 20, 55, 100, and 200 day benchmarks, while the short-term weekly session fib grid is still biased higher. The chart shows a recent rebound from the 1.15885 pivot low toward the 1.17035 pivot high area, but that move has not yet shifted the intermediate trend out of bearish structure. Price is sitting near the lower end of the recent range with mixed rotation and a moderate momentum profile, reflecting a market that has been recovering from the spring selloff but has not fully repaired the larger bearish footprint. Recent long signals align with the weekly bounce phase, yet the month and year session fib grids remain below their midlines, keeping the longer-cycle tone down. Resistance is layered overhead into the 1.17035 to 1.18195 zone, while support remains defined near 1.15885 and lower at 1.14840 and 1.14615. Overall, the tape looks like a countertrend rally inside a larger bearish daily and monthly framework, with consolidation and pivot-to-pivot rotation still dominating the swing picture.
Chart Analysis ATS AI Generated: 2026-05-26 07:00 for Informational use only, not trading advice. Terms and Risk Disclosure Copyright © 2026. Algo Trading Systems LLC.