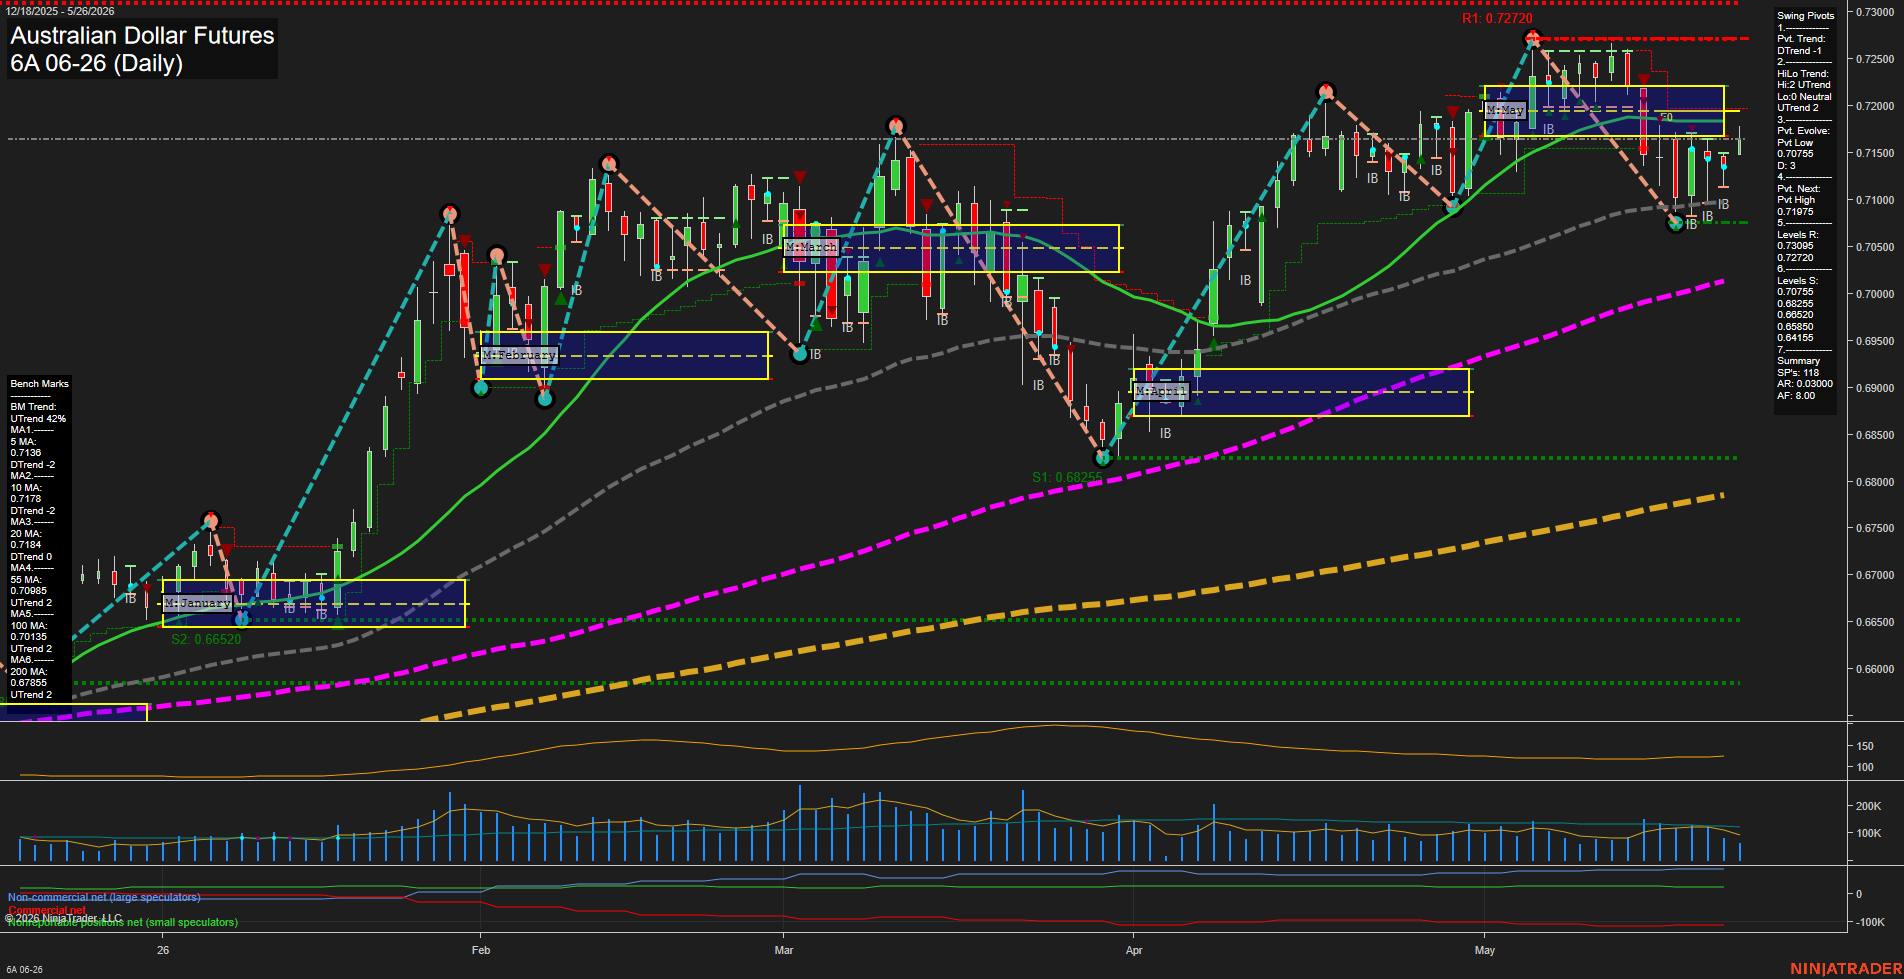
6A Australian Dollar Futures Daily Chart Analysis: 2026-May-26 07:00 CT
Price Action
- Last: 0.7144,
- Bars: Large,
- Mom: Average.
WSFG Weekly
- Short-Term
- WSFG Current: NA%
- F0%/NTZ' Bias: Price Neutral,
- WSFG Trend: Neutral.
MSFG Month May
- Intermediate-Term
- MSFG Current: 70%
- F0%/NTZ' Bias: Price Neutral,
- MSFG Trend: Neutral.
YSFG Year 2026
- Long-Term
- YSFG Current: NA%
- F0%/NTZ' Bias: Price Neutral,
- YSFG Trend: Neutral.
Swing Pivots
- (Short-Term) 1. Pvt. Trend: DTrend,
- (Intermediate-Term) 2. HiLo Trend: UTrend,
- 3. Pvt. Evolve: Pvt Low 0.70755,
- 4. Pvt. Next: Pvt High 0.71975,
- 5. Levels R: 0.73095, 0.72720,
- 6. Levels S: 0.70755, 0.68520, 0.68255, 0.65850, 0.64155.
Daily Benchmarks
- (Short-Term) 5 Day: 0.7136 Down Trend,
- (Short-Term) 10 Day: 0.7178 Down Trend,
- (Intermediate-Term) 20 Day: 0.7184 Down Trend,
- (Intermediate-Term) 55 Day: 0.7089 Up Trend,
- (Long-Term) 100 Day: 0.7035 Up Trend,
- (Long-Term) 200 Day: 0.6786 Up Trend.
Additional Metrics
Recent Trade Signals
- 26 May 2026: Long 6A 06-26 @ 0.7163 Signals.USAR-WSFG
Overall Rating
- Short-Term: Bearish,
- Intermediate-Term: Neutral,
- Long-Term: Bullish.
Key Insights Summary
The daily structure shows a strong multi-month advance that recently stalled beneath the May swing high zone, followed by a sharp pullback and a rebound attempt near the 0.70755 swing-low area. Short-term pivot trend remains DTrend, while the broader hi/lo pivot structure still leans constructive, reflecting a market that has not broken the larger rising sequence. Price is trading near the 5-day and 55-day areas, with the 10-day and 20-day benchmarks still rolling lower, which keeps the short-term tone heavy while the longer benchmarks remain upward sloped. The May MSFG is centered near the current trade area, indicating a balanced monthly value region rather than a decisive trend extension. The chart is in a retracement-and-retest phase after the run into the 0.72720 to 0.73095 resistance band, with the recent inside-bar behavior and repeated tests around the upper half of the monthly range signaling consolidation after expansion.
Chart Analysis ATS AI Generated: 2026-05-26 07:00 for Informational use only, not trading advice. Terms and Risk Disclosure Copyright © 2026. Algo Trading Systems LLC.