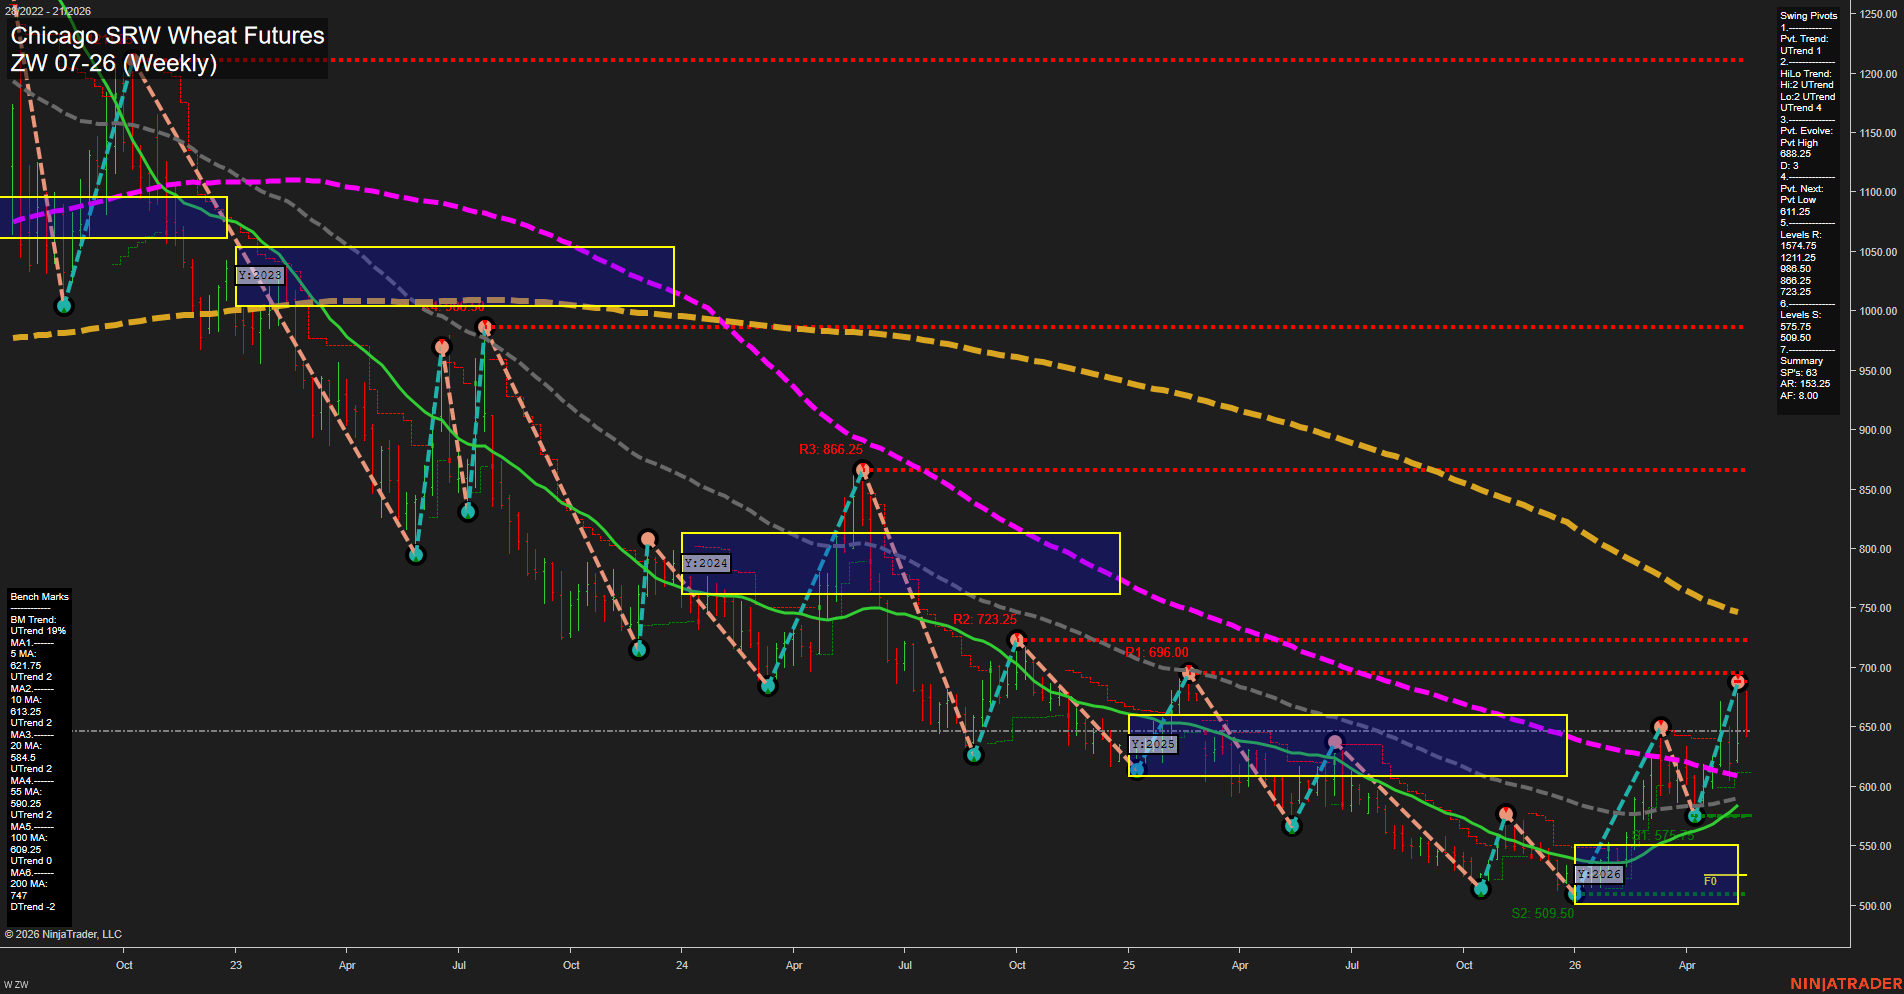
ZW Chicago SRW Wheat Futures Weekly Chart Analysis: 2026-May-25 07:09 CT
Price Action
- Last: 692.00,
- Bars: Large,
- Mom: Fast.
WSFG Weekly
- Short-Term
- WSFG Current: -1%
- F0%/NTZ' Bias: Price Below,
- WSFG Trend: Down.
MSFG Month May
- Intermediate-Term
- MSFG Current: 6%
- F0%/NTZ' Bias: Price Above,
- MSFG Trend: Up.
YSFG Year 2026
- Long-Term
- YSFG Current: 48%
- F0%/NTZ' Bias: Price Above,
- YSFG Trend: Up.
Swing Pivots
- (Short-Term) 1. Pvt. Trend: UTrend,
- (Intermediate-Term) 2. HiLo Trend: UTrend,
- 3. Pvt. Evolve: Pvt High 688.25,
- 4. Pvt. Next: Pvt Low 611.25,
- 5. Levels R: 1574.75, 1211.25, 986.50, 806.25, 723.25,
- 6. Levels S: 575.75, 509.50.
Weekly Benchmarks
- (Short-Term) 5 Day: 621.75 Up Trend,
- (Short-Term) 10 Day: 613.25 Up Trend,
- (Intermediate-Term) 20 Day: 584.50 Up Trend,
- (Intermediate-Term) 55 Day: 590.25 Up Trend,
- (Long-Term) 100 Day: 609.25 Up Trend,
- (Long-Term) 200 Day: 747.00 Down Trend.
Recent Trade Signals
- 21 May 2026: Short ZW 07-26 @ 652.5 Signals.USAR.TR120
- 18 May 2026: Long ZW 07-26 @ 657.75 Signals.USAR-WSFG
Overall Rating
- Short-Term: Neutral,
- Intermediate-Term: Bullish,
- Long-Term: Bullish.
Key Insights Summary
Wheat futures are extending a strong weekly upside reaction from the 2026 seasonal low zone, with a large bullish candle pushing price back above the key short- and intermediate-term benchmarks. The short-term WSFG remains below its midpoint and still points down, which keeps the near-term structure choppy and mixed even as the swing pivot sequence has turned back to UTrend with a fresh pivot high at 688.25. Intermediate and yearly session grids remain above their F0% references, reinforcing a constructive medium- to long-term backdrop. The benchmark stack is broadly supportive through the 5, 10, 20, 55, and 100 day measures, while the 200 day remains well overhead and down-sloping, preserving the broader cyclical divide. The recent signal set shows a short-term reversal sequence with both long and short prints in close succession, matching the volatile, two-sided nature of the current recovery leg.
Chart Analysis ATS AI Generated: 2026-05-25 07:09 for Informational use only, not trading advice. Terms and Risk Disclosure Copyright © 2026. Algo Trading Systems LLC.