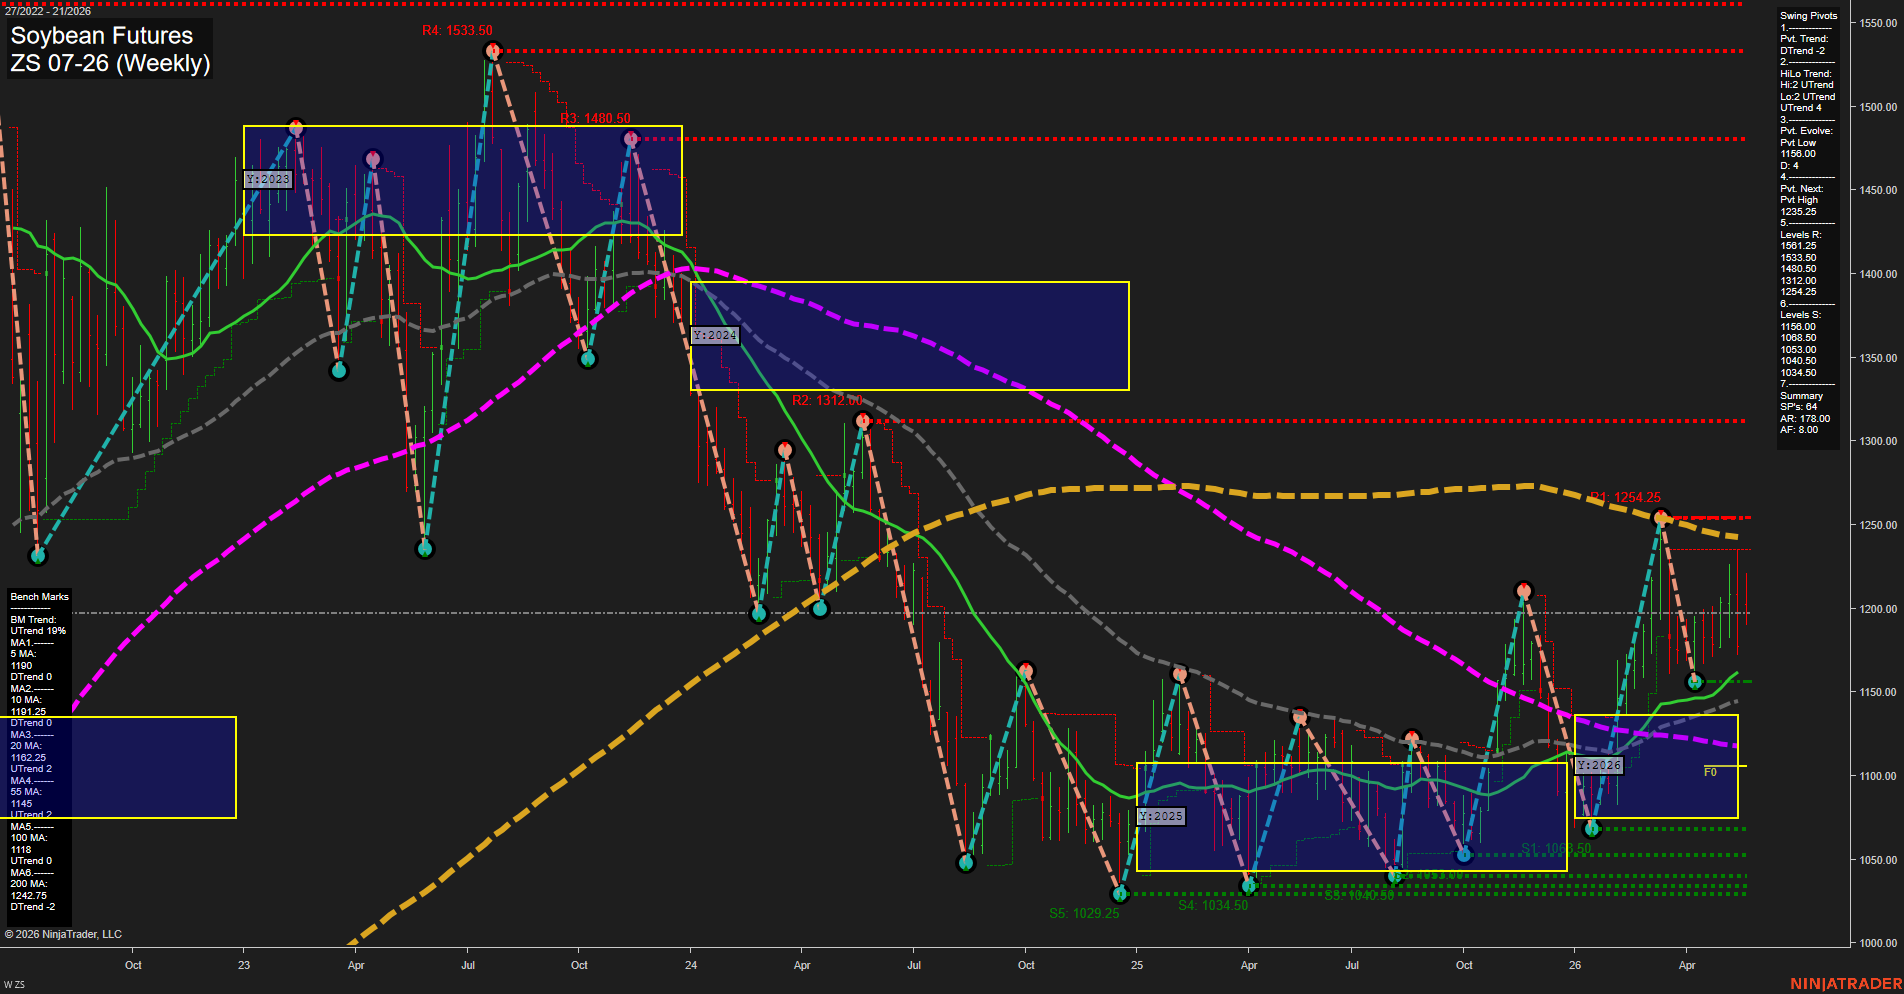
ZS Soybean Futures Weekly Chart Analysis: 2026-May-25 07:08 CT
Price Action
- Last: 1197.00,
- Bars: Large,
- Mom: Average.
WSFG Weekly
- Short-Term
- WSFG Current: -12%
- F0%/NTZ' Bias: Price Below,
- WSFG Trend: Down.
MSFG Month May
- Intermediate-Term
- MSFG Current: -8%
- F0%/NTZ' Bias: Price Below,
- MSFG Trend: Down.
YSFG Year 2026
- Long-Term
- YSFG Current: 30%
- F0%/NTZ' Bias: Price Above,
- YSFG Trend: Up.
Swing Pivots
- (Short-Term) 1. Pvt. Trend: DTrend,
- (Intermediate-Term) 2. HiLo Trend: UTrend,
- 3. Pvt. Evolve: Pvt Low 1158.00,
- 4. Pvt. Next: Pvt High 1235.25,
- 5. Levels R: 1561.25, 1533.50, 1480.50, 1312.00, 1254.25,
- 6. Levels S: 1158.00, 1068.50, 1053.00, 1040.50, 1034.50.
Weekly Benchmarks
- (Short-Term) 5 Day: 1190.00 Down Trend,
- (Short-Term) 10 Day: 1191.25 Down Trend,
- (Intermediate-Term) 20 Day: 1162.25 Up Trend,
- (Intermediate-Term) 55 Day: 1145.00 Up Trend,
- (Long-Term) 100 Day: 1118.00 Up Trend,
- (Long-Term) 200 Day: 1242.75 Down Trend.
Recent Trade Signals
- 22 May 2026: Short ZS 07-26 @ 1196.75 Signals.USAR-WSFG
- 20 May 2026: Short ZS 07-26 @ 1197.5 Signals.USAR.TR120
- 20 May 2026: Long ZS 07-26 @ 1210.25 Signals.USAR-MSFG
Overall Rating
- Short-Term: Bearish,
- Intermediate-Term: Bearish,
- Long-Term: Bullish.
Key Insights Summary
Weekly soybean futures are trading in a rebound phase after a deep 2024-2025 selloff and a series of lower highs/lower lows, but the current structure still leans soft on the shorter time frames. Price has lifted off the 2025 lows and is holding above the rising 20, 55, and 100 day benchmarks, which supports the broader recovery attempt, yet the weekly and monthly session fib grids remain below their F0 centers and are aligned with a down bias. The pivot structure is still short-term bearish with the next upside pivot reference above the market, while the recent short signals reflect the failure to sustain the earlier push through the 1235 area. Long-term context remains constructive because the 2026 yearly fib grid is above F0 and the market is operating inside that higher-year NTZ zone, even as the 200 day benchmark continues to slope lower.
Chart Analysis ATS AI Generated: 2026-05-25 07:08 for Informational use only, not trading advice. Terms and Risk Disclosure Copyright © 2026. Algo Trading Systems LLC.