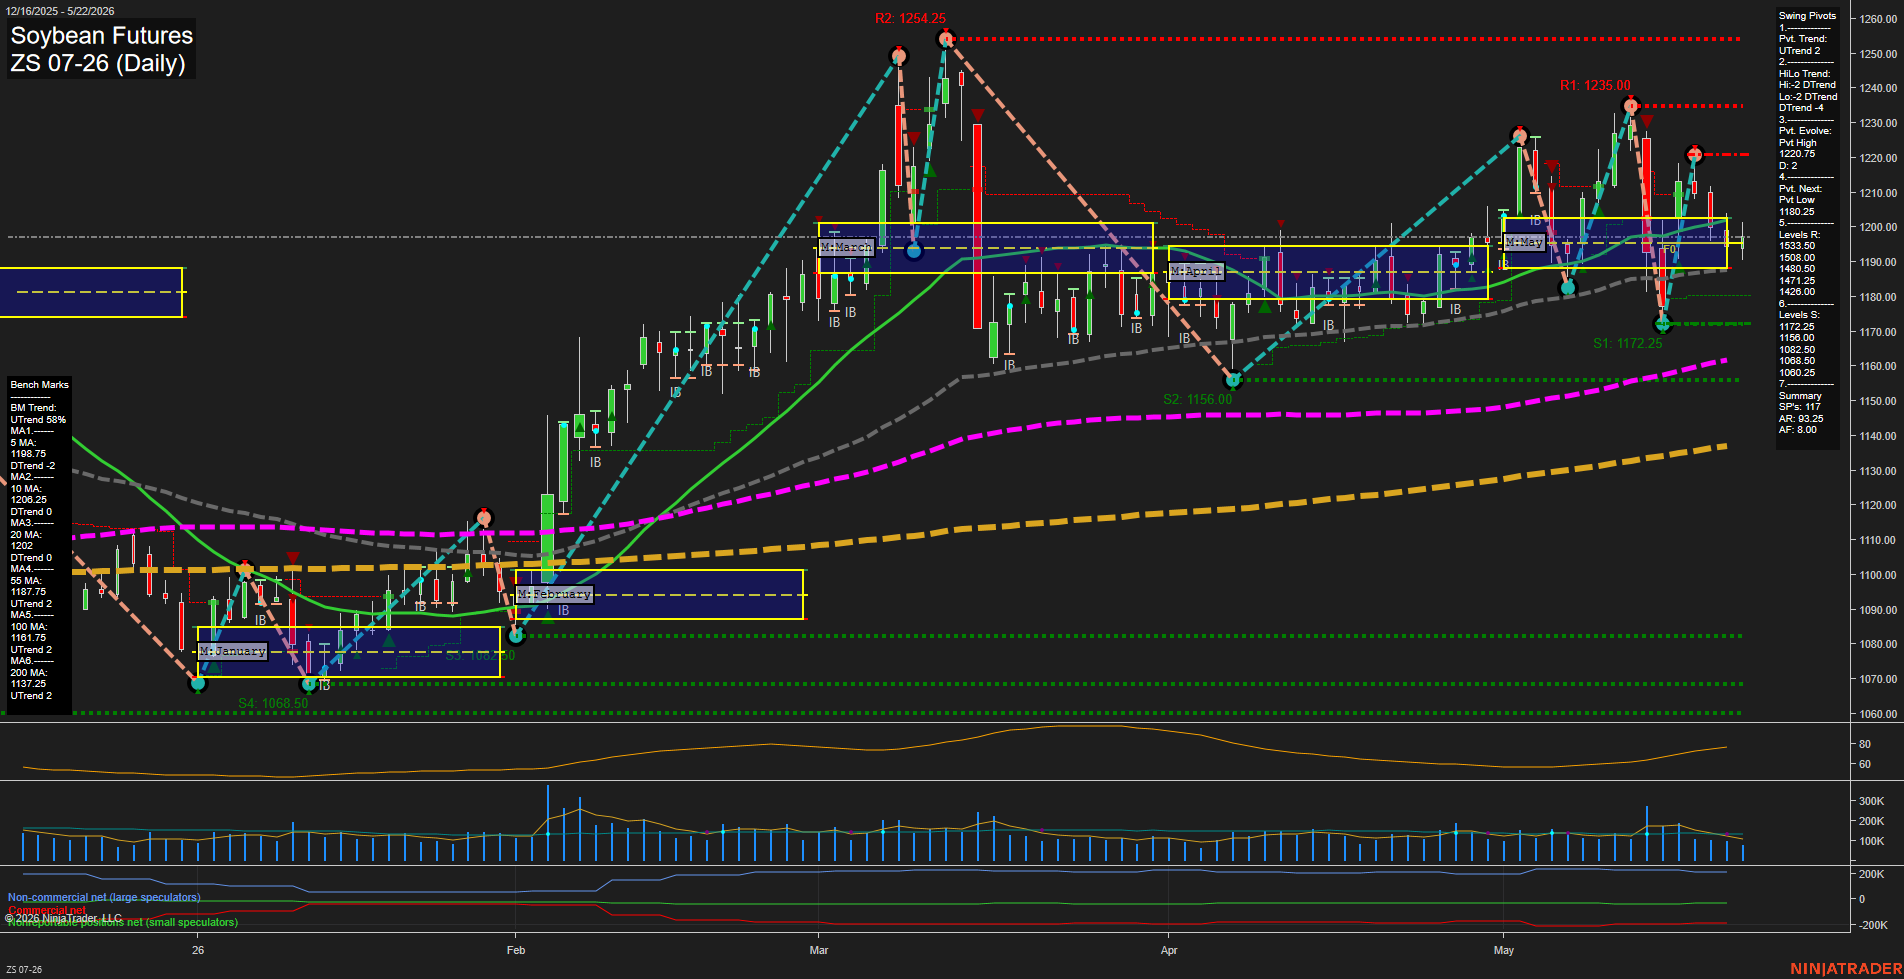
ZS Soybean Futures Daily Chart Analysis: 2026-May-25 07:08 CT
Price Action
- Last: 1198.75,
- Bars: Medium,
- Mom: average.
WSFG Weekly
- Short-Term
- WSFG Current: -12%
- F0%/NTZ' Bias: Price Below,
- WSFG Trend: Down.
MSFG Month May
- Intermediate-Term
- MSFG Current: -8%
- F0%/NTZ' Bias: Price Below,
- MSFG Trend: Down.
YSFG Year 2026
- Long-Term
- YSFG Current: 30%
- F0%/NTZ' Bias: Price Above,
- YSFG Trend: Up.
Swing Pivots
- (Short-Term) 1. Pvt. Trend: UTrend,
- (Intermediate-Term) 2. HiLo Trend: DTrend,
- 3. Pvt. Evolve: Pvt High 1220.75,
- 4. Pvt. Next: Pvt Low 1180.25,
- 5. Levels R: 1533.50, 1508.00, 1480.50, 1471.25, 1426.00,
- 6. Levels S: 1172.25, 1156.00, 1082.50, 1068.50.
Daily Benchmarks
- (Short-Term) 5 Day: 1198.75 Down Trend,
- (Short-Term) 10 Day: 1206.25 Down Trend,
- (Intermediate-Term) 20 Day: 1202.00 Down Trend,
- (Intermediate-Term) 55 Day: 1187.75 Up Trend,
- (Long-Term) 100 Day: 1161.75 Up Trend,
- (Long-Term) 200 Day: 1137.25 Up Trend.
Additional Metrics
- ATR: 93.25,
- VOLMA: 155181.
Recent Trade Signals
- 22 May 2026: Short ZS 07-26 @ 1196.75 Signals.USAR-WSFG
- 20 May 2026: Short ZS 07-26 @ 1197.5 Signals.USAR.TR120
- 20 May 2026: Long ZS 07-26 @ 1210.25 Signals.USAR-MSFG
Overall Rating
- Short-Term: Bearish,
- Intermediate-Term: Bearish,
- Long-Term: Bullish.
Key Insights Summary
Soybeans are trading in a choppy but still structurally constructive long-term uptrend, while the near-term tape remains under pressure. Price is holding around the 1198 area, below the weekly and monthly session fib centers, which keeps the short- and intermediate-term tone weak. Swing pivot structure shows a short-term UTrend, but the broader HiLo pivot model is still DTrend, reflecting a market that has recently rolled over from the 1220-1235 resistance zone. The benchmark stack is mixed: the 5, 10, and 20 day averages are leaning lower, while the 55, 100, and 200 day averages remain higher and rising, which supports the long-term bullish rating. Recent signals also show a sequence of short entries after the failed push into overhead resistance, reinforcing the current bearish short-term swing tone. The larger backdrop still favors an upward yearly trend, but the current daily setup is dominated by failed tests, lower swing highs, and consolidation beneath the upper pivot band.
Chart Analysis ATS AI Generated: 2026-05-25 07:08 for Informational use only, not trading advice. Terms and Risk Disclosure Copyright © 2026. Algo Trading Systems LLC.