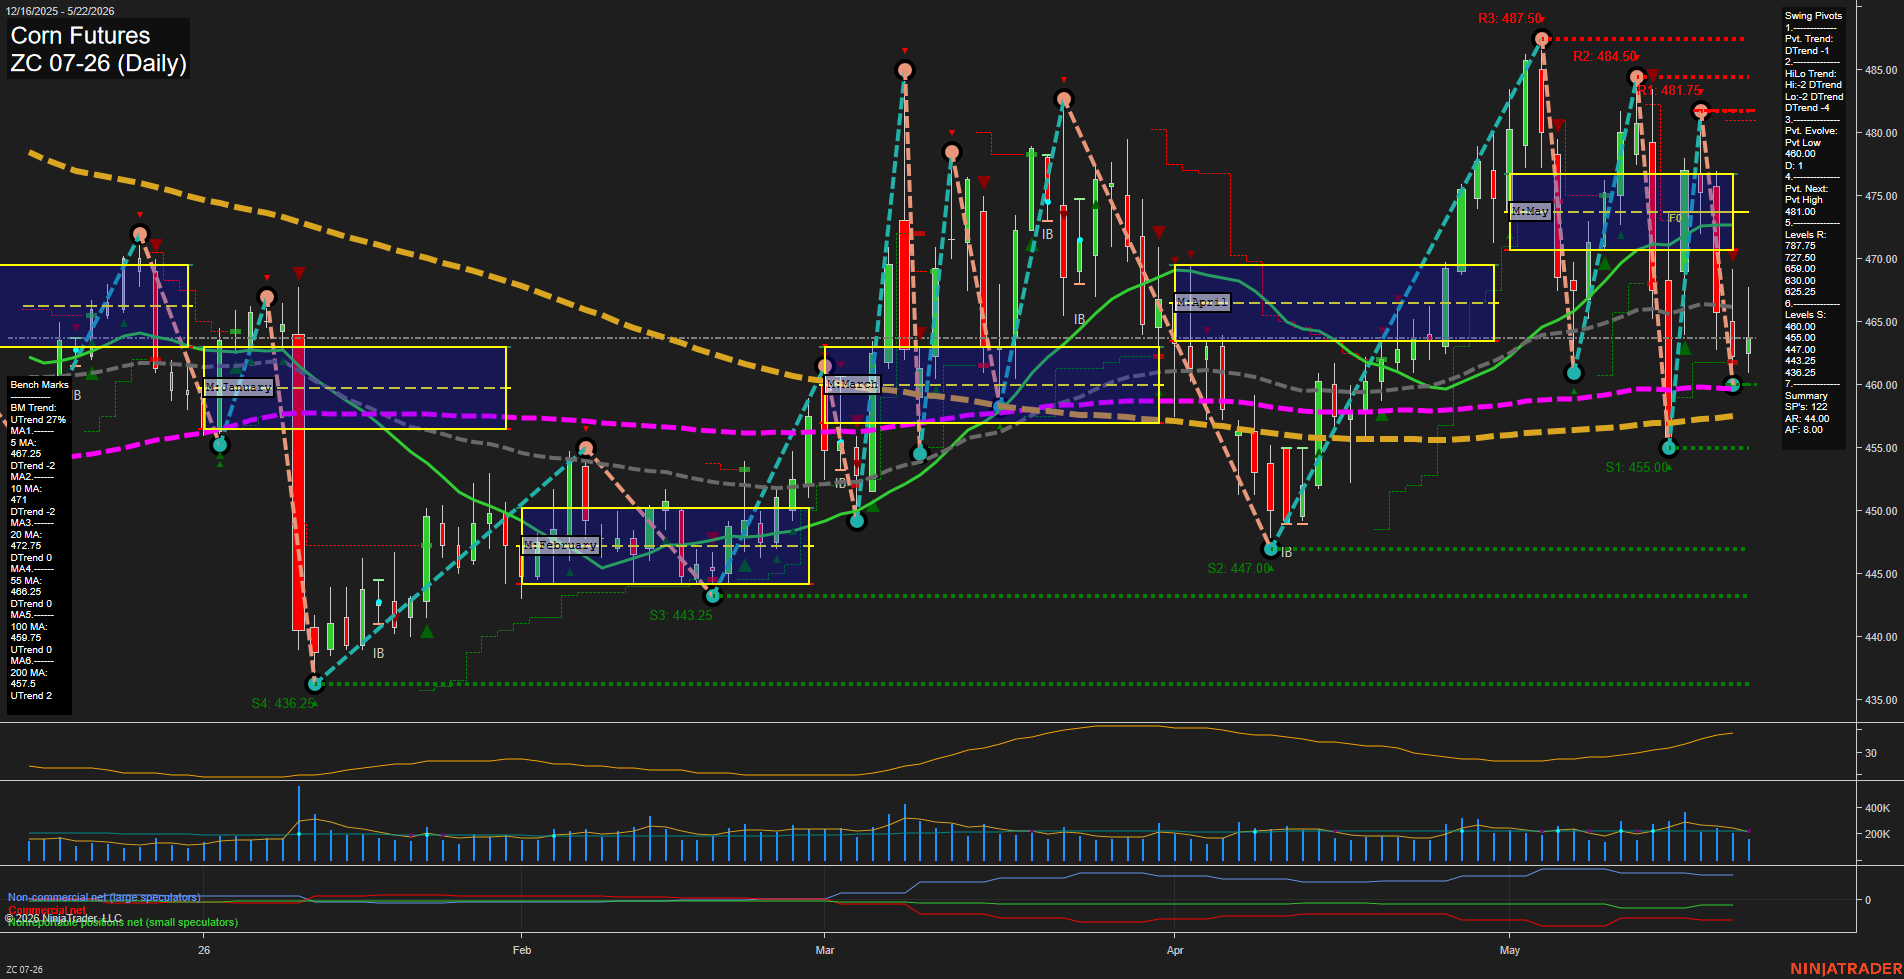
ZC Corn Futures Daily Chart Analysis: 2026-May-25 07:08 CT
Price Action
- Last: 460.00,
- Bars: Large,
- Mom: Fast.
WSFG Weekly
- Short-Term
- WSFG Current: -26%
- F0%/NTZ' Bias: Price Below,
- WSFG Trend: Down.
MSFG Month May
- Intermediate-Term
- MSFG Current: -56%
- F0%/NTZ' Bias: Price Below,
- MSFG Trend: Down.
YSFG Year 2026
- Long-Term
- YSFG Current: -3%
- F0%/NTZ' Bias: Price Below,
- YSFG Trend: Down.
Swing Pivots
- (Short-Term) 1. Pvt. Trend: DTrend,
- (Intermediate-Term) 2. HiLo Trend: DTrend,
- 3. Pvt. Evolve: Pvt Low 460.00,
- 4. Pvt. Next: Pvt High 481.00,
- 5. Levels R: 487.50, 484.50, 481.75,
- 6. Levels S: 455.00, 447.00, 443.25, 436.25.
Daily Benchmarks
- (Short-Term) 5 Day: 467.25 Down Trend,
- (Short-Term) 10 Day: 471.00 Down Trend,
- (Intermediate-Term) 20 Day: 472.75 Down Trend,
- (Intermediate-Term) 55 Day: 468.25 Down Trend,
- (Long-Term) 100 Day: 459.75 Up Trend,
- (Long-Term) 200 Day: 457.50 Up Trend.
Additional Metrics
- ATR: 44.00,
- VOLMA: 252019.
Recent Trade Signals
- 20 May 2026: Short ZC 07-26 @ 463.75 Signals.USAR.TR120
- 20 May 2026: Short ZC 07-26 @ 465 Signals.USAR-WSFG
- 19 May 2026: Long ZC 07-26 @ 480 Signals.USAR-MSFG
Overall Rating
- Short-Term: Bearish,
- Intermediate-Term: Bearish,
- Long-Term: Neutral.
Key Insights Summary
Corn futures are trading in a broadly corrective structure after the May rally failed near the 481.75 to 487.50 resistance band, with price now back near the 460 area and sitting below the weekly and monthly F0%/NTZ centers. The swing pivot sequence remains in a DTrend state, and the recent lower-high / lower-low behavior confirms short-term downside control. The daily benchmark stack is also weak in the front end, with the 5, 10, 20, and 55 day averages all leaning lower, while the 100 and 200 day benchmarks still show a longer-run underlying uptrend bias that is not yet fully broken. Recent signals reflect that transition, with short setups dominating after the earlier long signal near 480. The larger picture is choppy and rotational, with sharp rallies being sold into and rebounds finding resistance near prior pivot highs, leaving the market in a bearish short-term posture and a neutral-to-bearish intermediate backdrop.
Chart Analysis ATS AI Generated: 2026-05-25 07:08 for Informational use only, not trading advice. Terms and Risk Disclosure Copyright © 2026. Algo Trading Systems LLC.