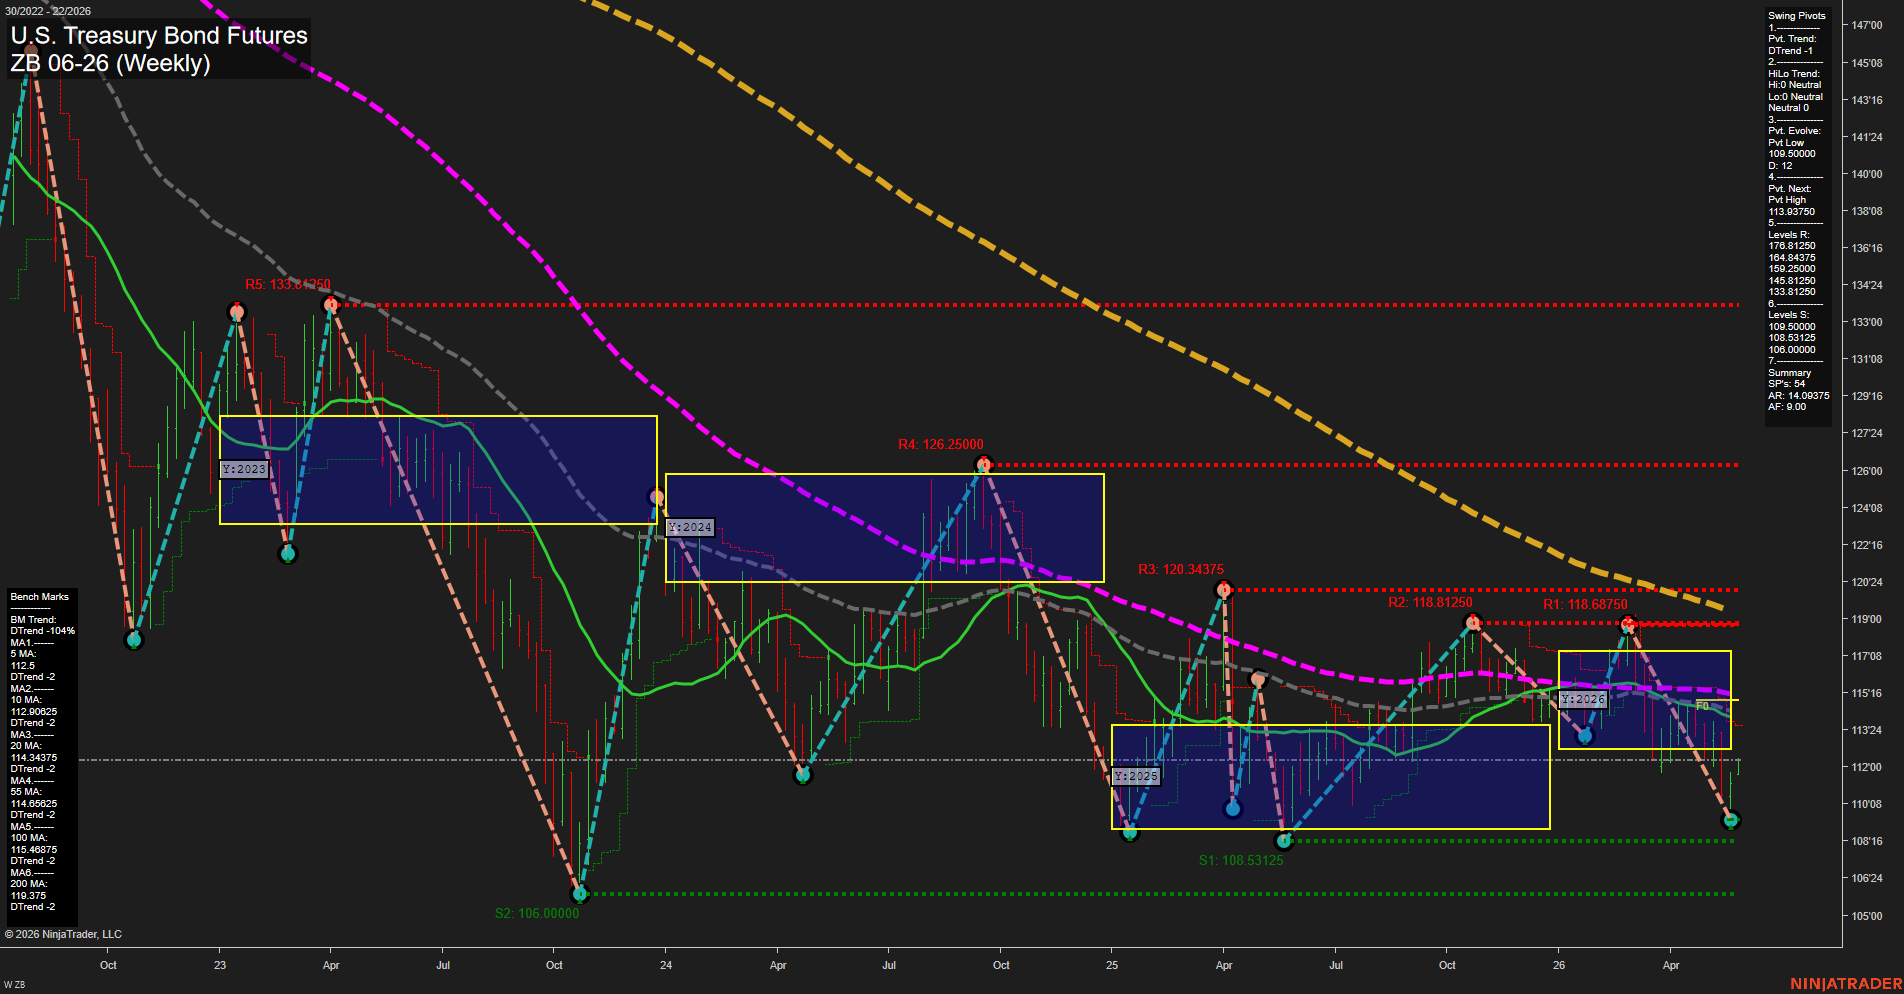
ZB U.S. Treasury Bond Futures Weekly Chart Analysis: 2026-May-25 07:08 CT
Price Action
- Last: 110'08,
- Bars: Large,
- Mom: fast.
WSFG Weekly
- Short-Term
- WSFG Current: NA%
- F0%/NTZ' Bias: Price Neutral,
- WSFG Trend: Neutral.
MSFG Month May
- Intermediate-Term
- MSFG Current: NA%
- F0%/NTZ' Bias: Price Neutral,
- MSFG Trend: Neutral.
YSFG Year 2026
- Long-Term
- YSFG Current: NA%
- F0%/NTZ' Bias: Price Neutral,
- YSFG Trend: Neutral.
Swing Pivots
- (Short-Term) 1. Pvt. Trend: DTrend,
- (Intermediate-Term) 2. HiLo Trend: Neutral,
- 3. Pvt. Evolve: Pvt Low 109.50000,
- 4. Pvt. Next: Pvt High 113.93750,
- 5. Levels R: 176.81250, 164.84375, 159.25000, 145.81250, 133.81250,
- 6. Levels S: 109.50000, 108.53125, 106.00000.
Weekly Benchmarks
- (Short-Term) 5 Day: 112.50000 Down Trend,
- (Short-Term) 10 Day: 112.90625 Down Trend,
- (Intermediate-Term) 20 Day: 114.34375 Down Trend,
- (Intermediate-Term) 55 Day: 114.65625 Down Trend,
- (Long-Term) 100 Day: 115.46875 Down Trend,
- (Long-Term) 200 Day: 119.37500 Down Trend.
Overall Rating
- Short-Term: Bearish,
- Intermediate-Term: Bearish,
- Long-Term: Bearish.
Key Insights Summary
The weekly structure remains in a clear downtrend with lower highs and lower lows dominating the swing map, and the most recent pivot sequence still points to a bearish continuation profile. Price is trading beneath all benchmark moving averages, confirming that the broader tape remains under pressure across short, intermediate, and long horizons. The pivot summary shows a DTrend reading with the next opposite pivot set as a higher pivot objective, which keeps the weekly market in a reactive, retracement-prone state rather than a confirmed reversal. The year-to-date fib grid remains neutral in bias framing, but price action is holding on the lower side of the broader value area, reflecting a market that has spent much of 2025-2026 working through a broad corrective decline with intermittent bounce attempts that have failed beneath major resistance. The repeated rejection from prior swing highs and the current location below the 20, 55, 100, and 200 day benchmarks reinforce a bearish swing backdrop with volatility still elevated and trend control still favoring sellers on the weekly chart.
Chart Analysis ATS AI Generated: 2026-05-25 07:08 for Informational use only, not trading advice. Terms and Risk Disclosure Copyright © 2026. Algo Trading Systems LLC.