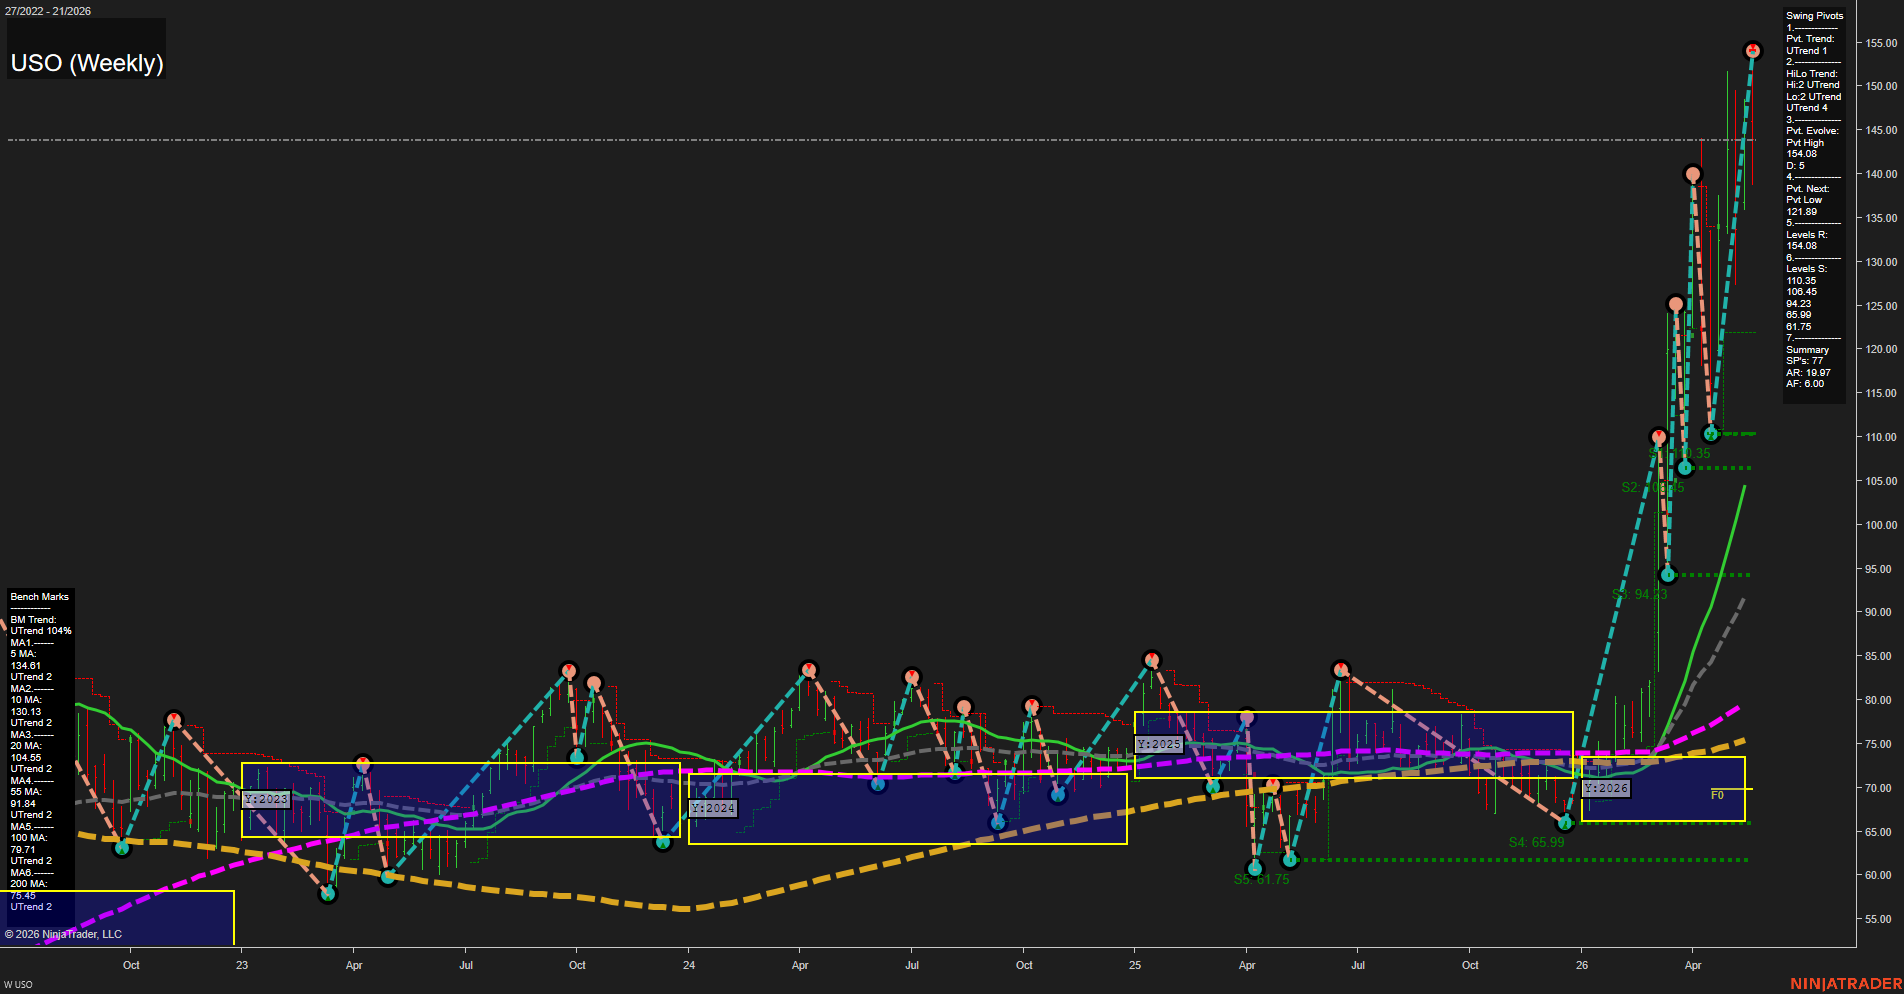
USO United States Oil Fund LP Weekly Chart Analysis: 2026-May-25 07:07 CT
Price Action
- Last: 154.08,
- Bars: Large,
- Mom: Fast.
WSFG Weekly
- Short-Term
- WSFG Current: NA%
- F0%/NTZ' Bias: Price Neutral,
- WSFG Trend: Bullish.
MSFG Month May
- Intermediate-Term
- MSFG Current: NA%
- F0%/NTZ' Bias: Price Neutral,
- MSFG Trend: Bullish.
YSFG Year 2026
- Long-Term
- YSFG Current: NA%
- F0%/NTZ' Bias: Price Neutral,
- YSFG Trend: Bullish.
Swing Pivots
- (Short-Term) 1. Pvt. Trend: UTrend,
- (Intermediate-Term) 2. HiLo Trend: UTrend,
- 3. Pvt. Evolve: Pvt High 154.08,
- 4. Pvt. Next: Pvt Low 121.89,
- 5. Levels R: 154.08,
- 6. Levels S: 110.35, 108.45, 94.23, 65.99, 61.75.
Weekly Benchmarks
- (Short-Term) 5 Day: 134.61 Up Trend,
- (Short-Term) 10 Day: 130.13 Up Trend,
- (Intermediate-Term) 20 Day: 104.55 Up Trend,
- (Intermediate-Term) 55 Day: 91.84 Up Trend,
- (Long-Term) 100 Day: 79.71 Up Trend,
- (Long-Term) 200 Day: 75.45 Up Trend.
Overall Rating
- Short-Term: Bullish,
- Intermediate-Term: Bullish,
- Long-Term: Bullish.
Key Insights Summary
USO is in a strong weekly expansion phase with price pushing to new swing highs near 154.08 after a steep vertical advance. The pivot structure remains firmly in UTrend across both short- and intermediate-term readings, while the benchmark moving averages are stacked and rising in a classic trend-confirmation alignment. The chart shows a powerful breakout sequence from the 2026 base area, with prior resistance zones being cleared in fast momentum and little overhead supply visible above the current high. The long-term structure remains constructive as price holds well above the major moving averages and yearly fib framework, while the recent surge reflects a breakout rather than a broad congestion pattern.
Chart Analysis ATS AI Generated: 2026-05-25 07:07 for Informational use only, not trading advice. Terms and Risk Disclosure Copyright © 2026. Algo Trading Systems LLC.