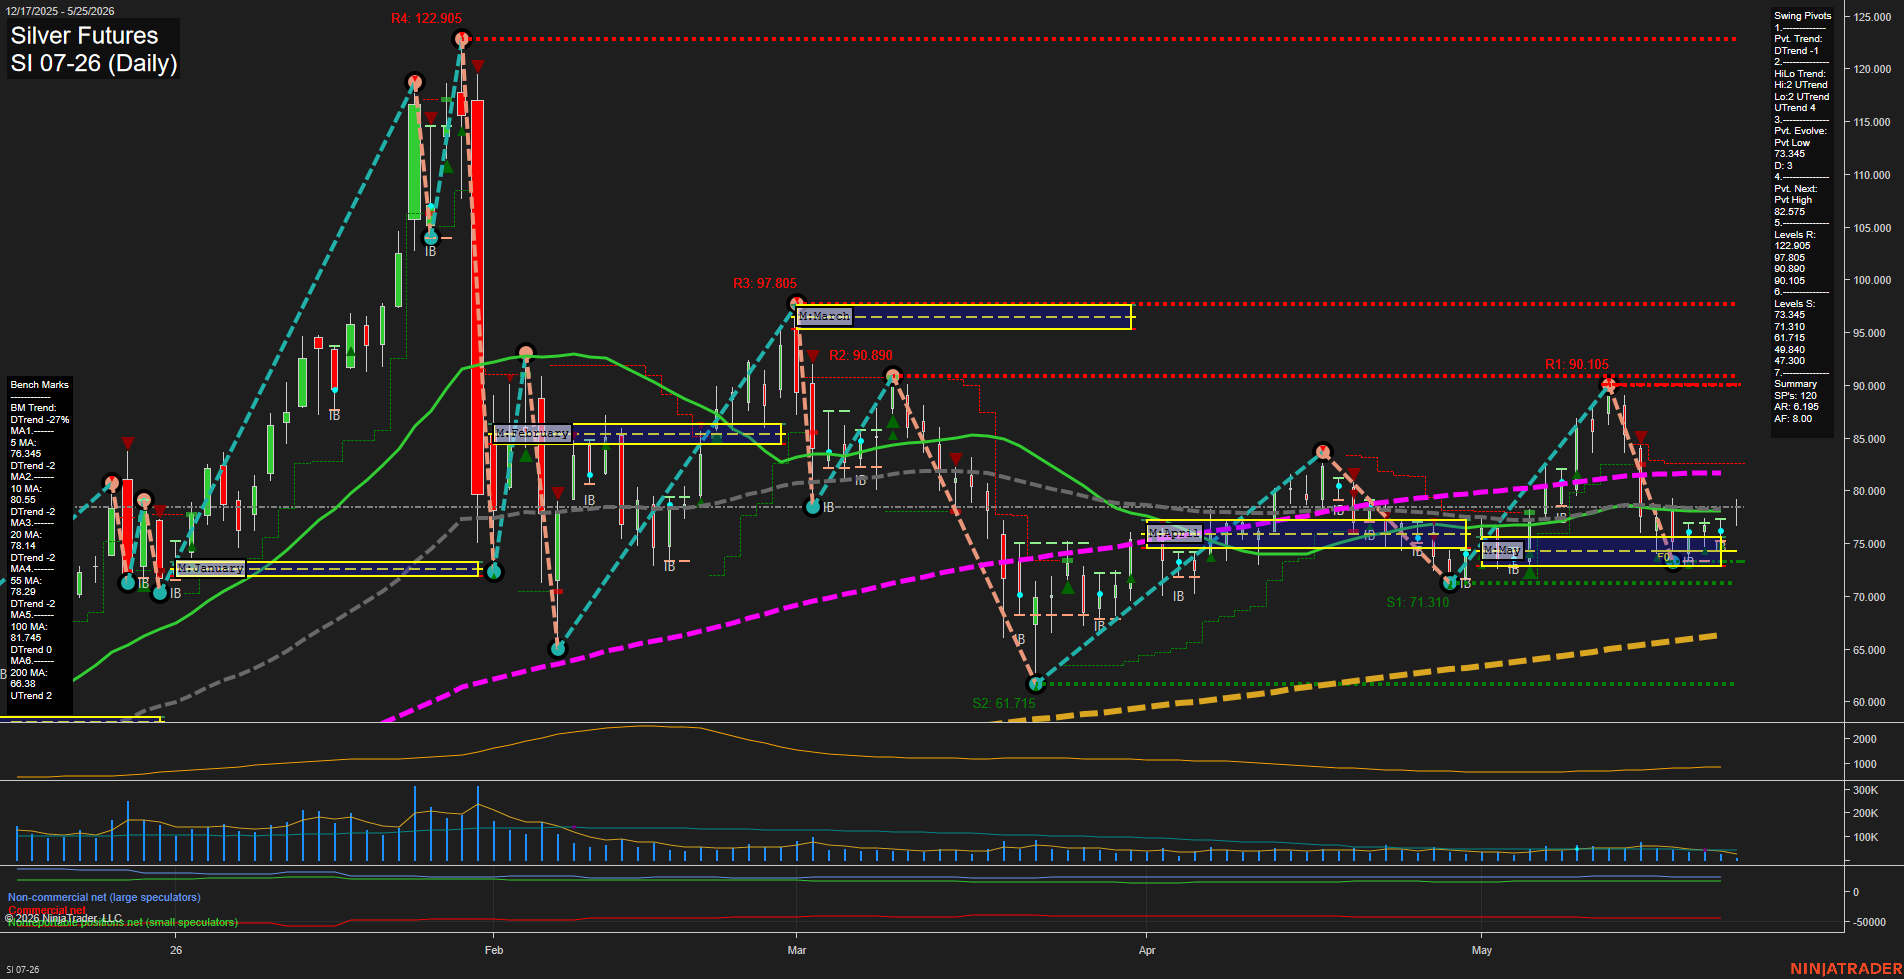
SI Silver Futures Daily Chart Analysis: 2026-May-25 07:06 CT
Price Action
- Last: 74.0,
- Bars: Medium,
- Mom: Slow.
WSFG Weekly
- Short-Term
- WSFG Current: 18%
- F0%/NTZ' Bias: Price Above,
- WSFG Trend: Up.
MSFG Month May
- Intermediate-Term
- MSFG Current: 11%
- F0%/NTZ' Bias: Price Above,
- MSFG Trend: Up.
YSFG Year 2026
- Long-Term
- YSFG Current: -22%
- F0%/NTZ' Bias: Price Below,
- YSFG Trend: Down.
Swing Pivots
- (Short-Term) 1. Pvt. Trend: DTrend,
- (Intermediate-Term) 2. HiLo Trend: UTrend,
- 3. Pvt. Evolve: Pvt Low 73.345,
- 4. Pvt. Next: Pvt High 82.575,
- 5. Levels R: 122.905, 97.805, 90.890, 90.105,
- 6. Levels S: 73.345, 71.310, 61.715, 49.840, 47.300.
Daily Benchmarks
- (Short-Term) 5 Day: 76.345 Down Trend,
- (Short-Term) 10 Day: 80.55 Down Trend,
- (Intermediate-Term) 20 Day: 78.14 Down Trend,
- (Intermediate-Term) 55 Day: 78.29 Down Trend,
- (Long-Term) 100 Day: 81.745 Down Trend,
- (Long-Term) 200 Day: 68.38 Up Trend.
Additional Metrics
Recent Trade Signals
- 25 May 2026: Long SI 07-26 @ 78.255 Signals.USAR-MSFG
- 25 May 2026: Long SI 07-26 @ 78.06 Signals.USAR-WSFG
- 25 May 2026: Long SI 07-26 @ 78.575 Signals.USAR.TR120
Overall Rating
- Short-Term: Bearish,
- Intermediate-Term: Neutral,
- Long-Term: Neutral.
Key Insights Summary
Silver is trading in a broad corrective structure after a sharp spring rally and subsequent selloff from the 90s area back into the mid-70s. The short-term swing pivot remains in a DTrend sequence, and price is sitting below the cluster of 5, 10, 20, 55, and 100-day benchmarks, which keeps the near-term tone soft despite the intact 200-day uptrend. Weekly and monthly session fib grids still show price above their NTZ/F0% zones, which preserves a broader upward session bias, while the yearly grid remains under pressure and still reflects a down year profile. The chart is showing a consolidation-to-recovery attempt around the 73 to 75 area, with support layers at 73.345 and 71.310 acting as the nearby pivot structure and the 82.575 pivot high marking the next major swing reference. Overall, the pattern reads as a mixed tape: short-term bearish drift inside a larger neutral-to-up session framework, with volatility contracting after the prior expansion and the market working through a lower-highs, higher-lows transition zone.
Chart Analysis ATS AI Generated: 2026-05-25 07:06 for Informational use only, not trading advice. Terms and Risk Disclosure Copyright © 2026. Algo Trading Systems LLC.