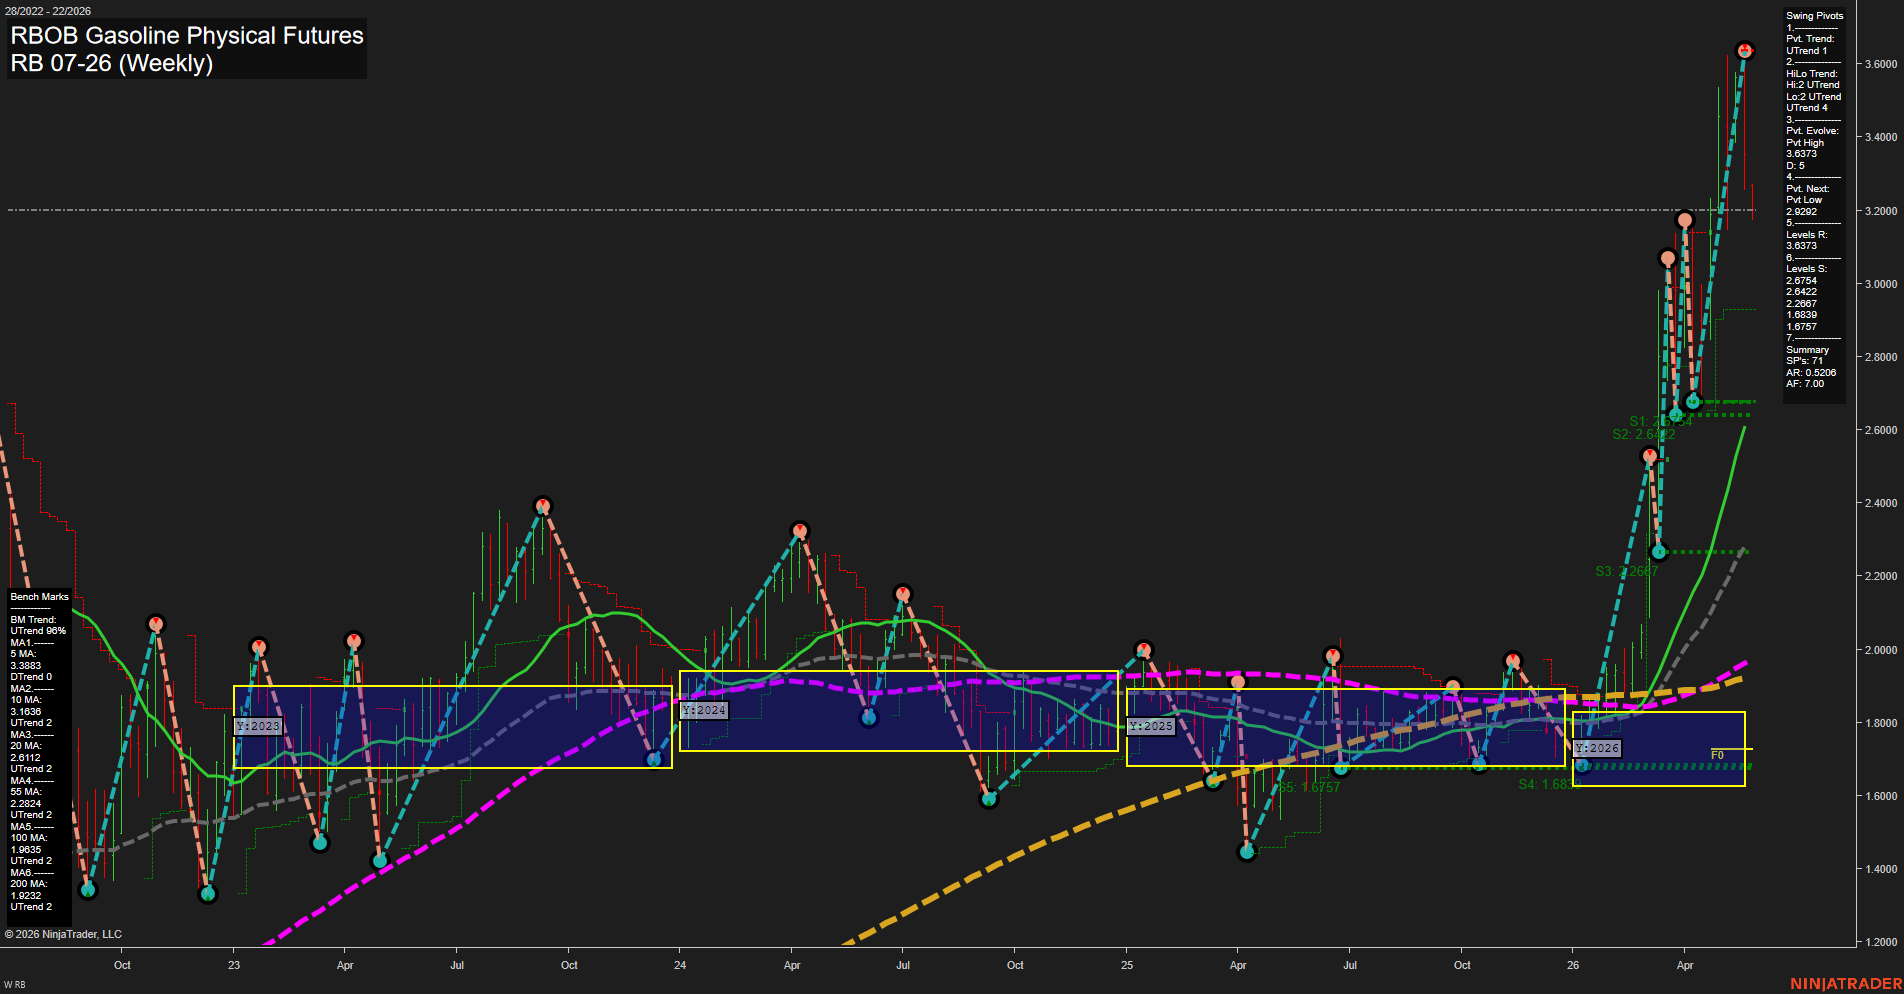
RB RBOB Gasoline Physical Futures Weekly Chart Analysis: 2026-May-25 07:05 CT
Price Action
- Last: 3.6373,
- Bars: Large,
- Mom: fast.
WSFG Weekly
- Short-Term
- WSFG Current: -19%
- F0%/NTZ' Bias: Price Below,
- WSFG Trend: Down.
MSFG Month May
- Intermediate-Term
- MSFG Current: -52%
- F0%/NTZ' Bias: Price Below,
- MSFG Trend: Down.
YSFG Year 2026
- Long-Term
- YSFG Current: 147%
- F0%/NTZ' Bias: Price Above,
- YSFG Trend: Up.
Swing Pivots
- (Short-Term) 1. Pvt. Trend: UTrend,
- (Intermediate-Term) 2. HiLo Trend: UTrend,
- 3. Pvt. Evolve: Pvt High 3.6373,
- 4. Pvt. Next: Pvt Low 2.9292,
- 5. Levels R: 3.6373,
- 6. Levels S: 2.6754, 2.6422, 2.2867, 1.6839, 1.6757.
Weekly Benchmarks
- (Short-Term) 5 Day: 3.3883 Down Trend,
- (Short-Term) 10 Day: 3.1636 Up Trend,
- (Intermediate-Term) 20 Day: 2.6112 Up Trend,
- (Intermediate-Term) 55 Day: 2.2824 Up Trend,
- (Long-Term) 100 Day: 1.9835 Up Trend,
- (Long-Term) 200 Day: 1.9232 Up Trend.
Recent Trade Signals
- 25 May 2026: Short RB 07-26 @ 3.198 Signals.USAR-WSFG
- 21 May 2026: Short RB 07-26 @ 3.388 Signals.USAR-MSFG
- 20 May 2026: Short RB 07-26 @ 3.4274 Signals.USAR.TR120
Overall Rating
- Short-Term: Bearish,
- Intermediate-Term: Bearish,
- Long-Term: Bullish.
Key Insights Summary
RB RBOB gasoline is showing a sharp weekly upside expansion into a fresh swing high at 3.6373, but the broader session-grid context remains mixed-to-bearish in the near term because both WSFG and MSFG are below F0% and trending down. The weekly pivot structure is still in UTrend and HiLo Trend is also UTrend, which confirms the recent thrust higher as a continuation leg rather than a failed rally. Long-term structure remains constructive: YSFG is firmly above F0% with an up trend, and all major benchmarks from 10-day through 200-day are aligned higher, supporting the larger bullish backdrop. The price action is extended and impulsive, with the latest move taking out prior overhead pivot levels and leaving a fast momentum profile, while the short-term trade signals have recently stayed aligned with the downside session-grid bias before this breakout phase. Overall, the chart shows a strong long-term uptrend layered over a short-term corrective/mean-reverting session-grid regime that has just been overridden by an aggressive weekly rally.
Chart Analysis ATS AI Generated: 2026-05-25 07:05 for Informational use only, not trading advice. Terms and Risk Disclosure Copyright © 2026. Algo Trading Systems LLC.