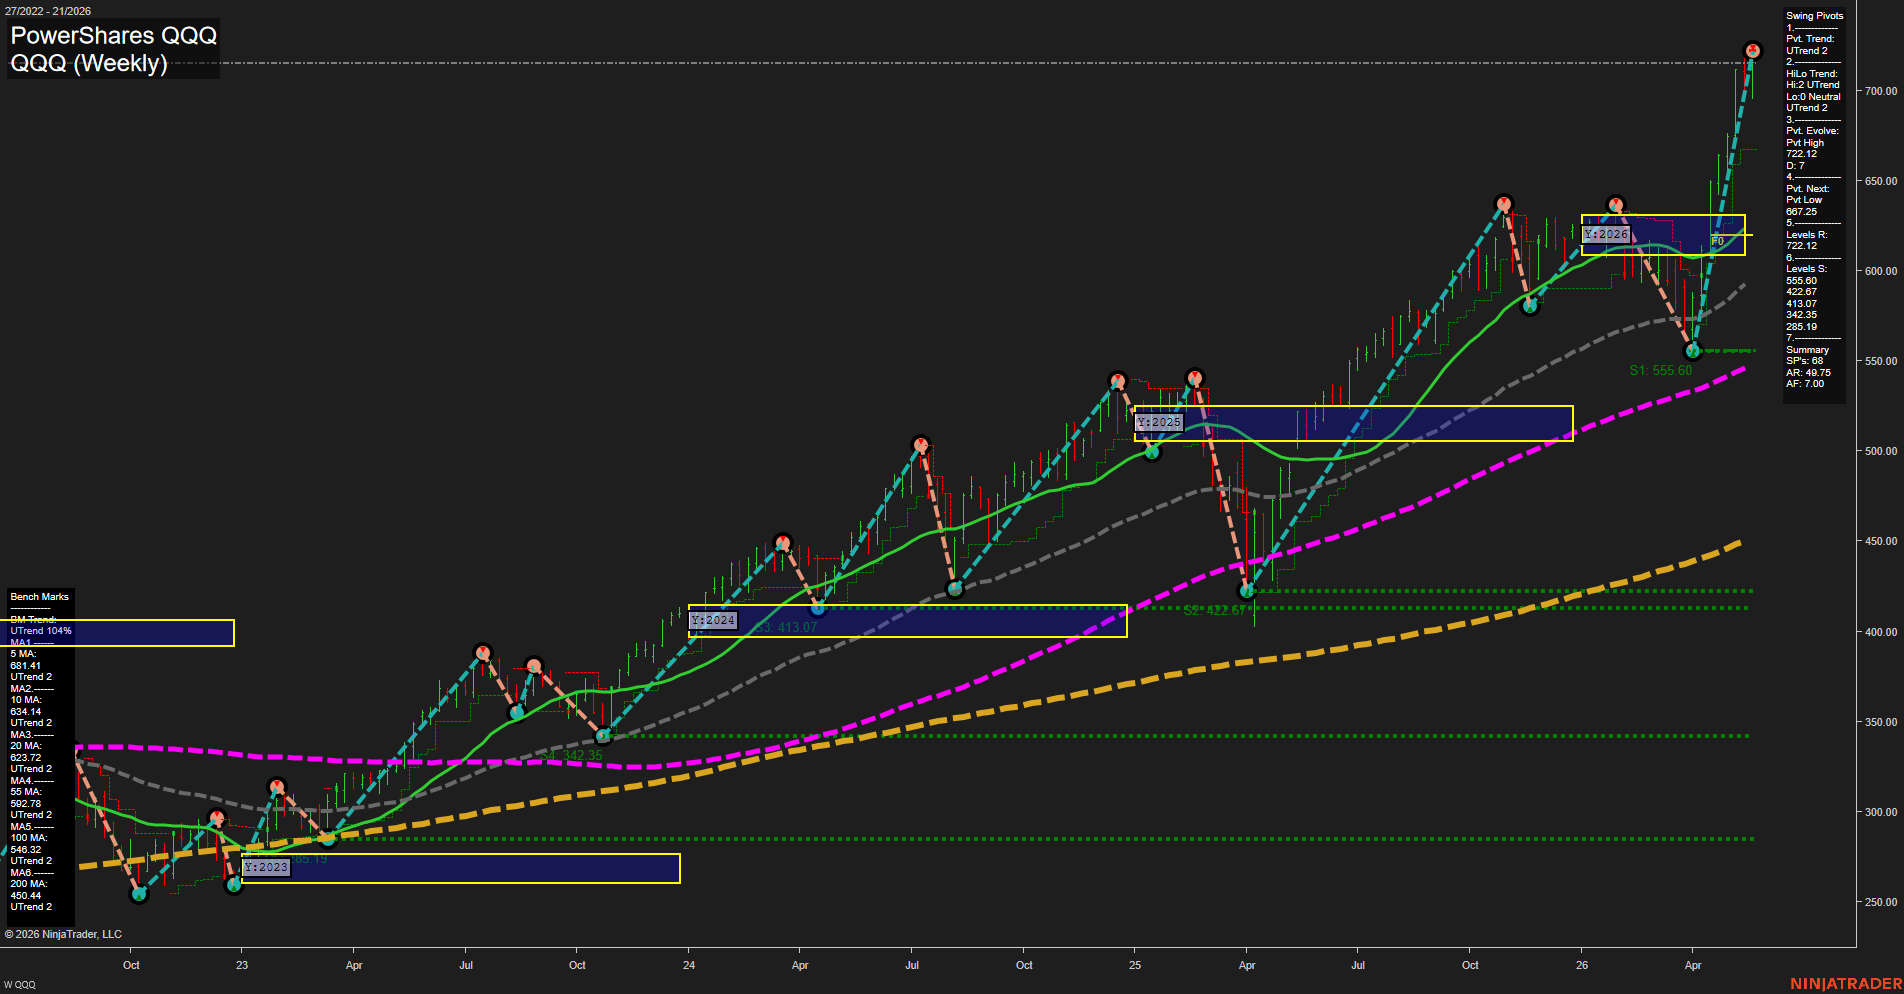
QQQ PowerShares QQQ Weekly Chart Analysis: 2026-May-25 07:05 CT
Price Action
- Last: 722.12,
- Bars: Large,
- Mom: fast.
WSFG Weekly
- Short-Term
- WSFG Current: NA%
- F0%/NTZ' Bias: Price Neutral,
- WSFG Trend: Neutral.
MSFG Month May
- Intermediate-Term
- MSFG Current: NA%
- F0%/NTZ' Bias: Price Neutral,
- MSFG Trend: Neutral.
YSFG Year 2026
- Long-Term
- YSFG Current: NA%
- F0%/NTZ' Bias: Price Neutral,
- YSFG Trend: Neutral.
Swing Pivots
- (Short-Term) 1. Pvt. Trend: UTrend,
- (Intermediate-Term) 2. HiLo Trend: UTrend,
- 3. Pvt. Evolve: Pvt High 722.12,
- 4. Pvt. Next: Pvt Low 687.25,
- 5. Levels R: 722.12,
- 6. Levels S: 555.60, 422.67, 413.07, 342.35, 285.19.
Weekly Benchmarks
- (Short-Term) 5 Day: 681.41 Up Trend,
- (Short-Term) 10 Day: 634.14 Up Trend,
- (Intermediate-Term) 20 Day: 623.72 Up Trend,
- (Intermediate-Term) 55 Day: 592.78 Up Trend,
- (Long-Term) 100 Day: 548.32 Up Trend,
- (Long-Term) 200 Day: 450.44 Up Trend.
Overall Rating
- Short-Term: Bullish,
- Intermediate-Term: Bullish,
- Long-Term: Bullish.
Key Insights Summary
QQQ remains in a powerful weekly uptrend with price at a fresh swing high near 722.12 and momentum running fast. The pivot structure is still firmly UTrend on both the short-term and intermediate-term views, while the benchmark stack stays positively aligned with every listed moving average rising beneath price. The chart shows a sequence of higher highs and higher lows, with the latest impulsive leg extending sharply above the prior consolidation and keeping the yearly 2026 structure constructive. The larger pattern continues to favor trend continuation behavior rather than a reversal profile, with prior year and session zones acting as reference areas beneath current price and the current breakout sitting well above the mid and long-duration moving averages.
Chart Analysis ATS AI Generated: 2026-05-25 07:05 for Informational use only, not trading advice. Terms and Risk Disclosure Copyright © 2026. Algo Trading Systems LLC.