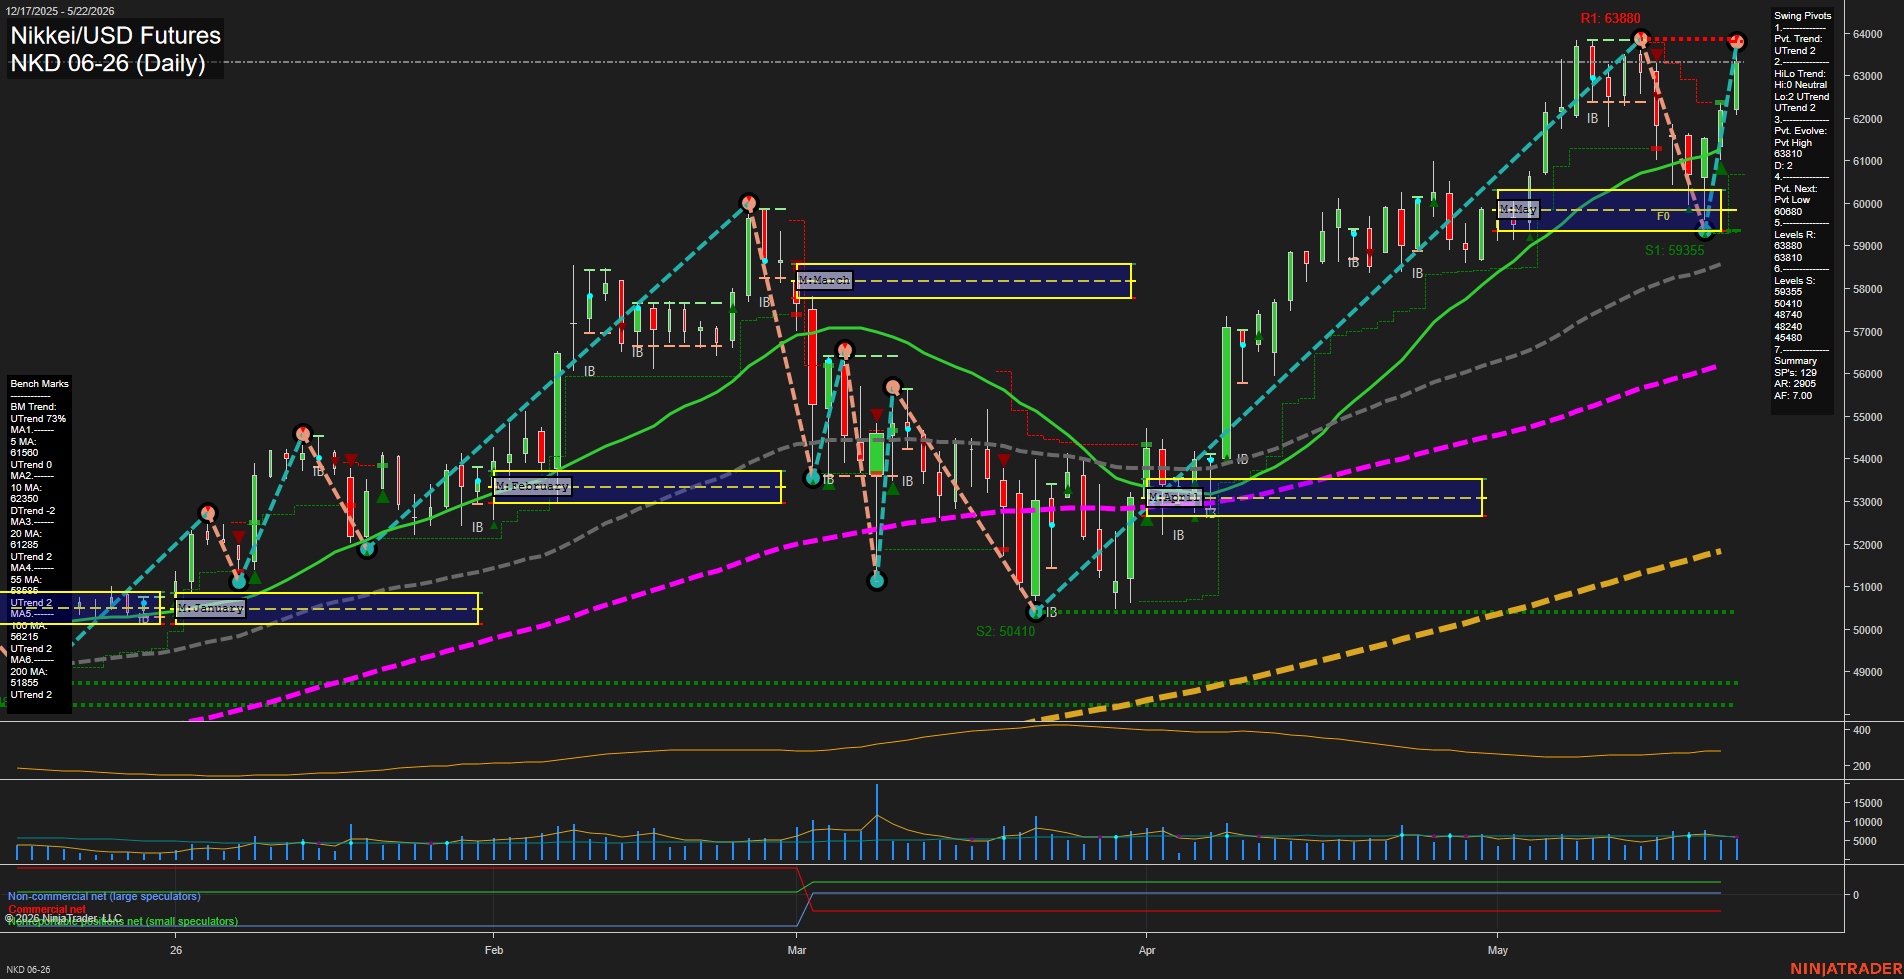
NKD Nikkei/USD Futures Daily Chart Analysis: 2026-May-25 07:04 CT
Price Action
- Last: 63810,
- Bars: Large,
- Mom: fast.
WSFG Weekly
- Short-Term
- WSFG Current: 44%
- F0%/NTZ' Bias: Price Above,
- WSFG Trend: Up.
MSFG Month May
- Intermediate-Term
- MSFG Current: 86%
- F0%/NTZ' Bias: Price Above,
- MSFG Trend: Up.
YSFG Year 2026
- Long-Term
- YSFG Current: 171%
- F0%/NTZ' Bias: Price Above,
- YSFG Trend: Up.
Swing Pivots
- (Short-Term) 1. Pvt. Trend: UTrend,
- (Intermediate-Term) 2. HiLo Trend: UTrend,
- 3. Pvt. Evolve: Pvt High 63810,
- 4. Pvt. Next: Pvt Low 60680,
- 5. Levels R: 63880, 63810,
- 6. Levels S: 59355, 50410, 48740, 48240, 45480.
Daily Benchmarks
- (Short-Term) 5 Day: 61560 Up Trend,
- (Short-Term) 10 Day: 62350 Down Trend,
- (Intermediate-Term) 20 Day: 61285 Up Trend,
- (Intermediate-Term) 55 Day: 58595 Up Trend,
- (Long-Term) 100 Day: 56610 Up Trend,
- (Long-Term) 200 Day: 51855 Up Trend.
Additional Metrics
Recent Trade Signals
- 21 May 2026: Long NKD 06-26 @ 62255 Signals.USAR-WSFG
- 20 May 2026: Long NKD 06-26 @ 61350 Signals.USAR.TR120
- 20 May 2026: Long NKD 06-26 @ 61200 Signals.USAR-MSFG
- 19 May 2026: Short NKD 06-26 @ 60570 Signals.USAR.TR720
Overall Rating
- Short-Term: Bullish,
- Intermediate-Term: Bullish,
- Long-Term: Bullish.
Key Insights Summary
The daily structure remains firmly trend-up with price back at the upper end of the recent expansion and pressing into the 63810 to 63880 resistance band. Weekly, monthly, and yearly fib grids are all aligned above F0%, which keeps the broader bias constructive and confirms the recovery has stayed intact after the April volatility dip. Swing pivots show a short-term UTrend with the latest pivot marked as a high and the next reversal reference below at 60680, while the higher-timeframe pivot structure still favors an advancing sequence of higher highs and higher lows. Benchmarks are stacked positively overall, with the 5, 20, 55, 100, and 200 day averages all rising, even as the 10 day sits below price, reflecting a strong trend with a short-term pullback rhythm. Volume and ATR readings point to an active, expanded daily range environment, and the recent signal cluster is net supportive of the ongoing upside phase.
Chart Analysis ATS AI Generated: 2026-05-25 07:04 for Informational use only, not trading advice. Terms and Risk Disclosure Copyright © 2026. Algo Trading Systems LLC.