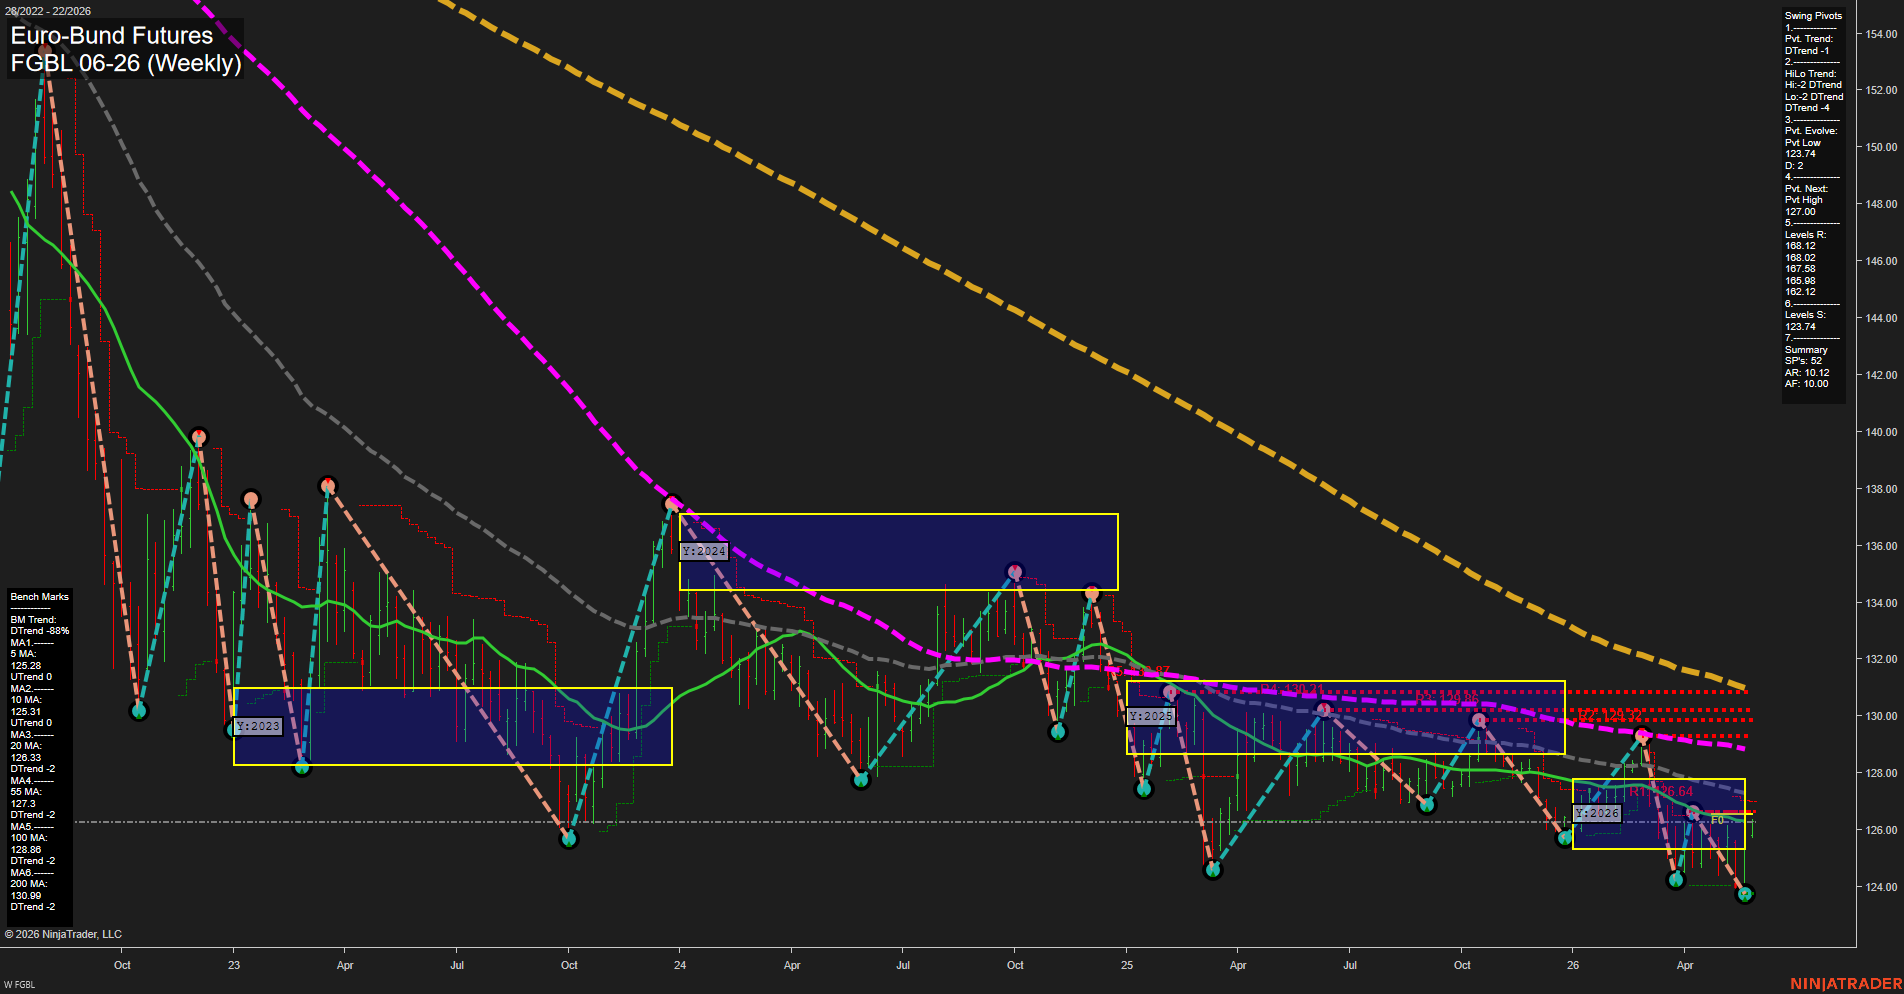
FGBL Euro-Bund Futures Weekly Chart Analysis: 2026-May-25 07:03 CT
Price Action
- Last: 126.64,
- Bars: Large,
- Mom: fast.
WSFG Weekly
- Short-Term
- WSFG Current: 34%
- F0%/NTZ' Bias: Price Above,
- WSFG Trend: Up.
MSFG Month May
- Intermediate-Term
- MSFG Current: 33%
- F0%/NTZ' Bias: Price Above,
- MSFG Trend: Up.
YSFG Year 2026
- Long-Term
- YSFG Current: -2%
- F0%/NTZ' Bias: Price Below,
- YSFG Trend: Down.
Swing Pivots
- (Short-Term) 1. Pvt. Trend: DTrend,
- (Intermediate-Term) 2. HiLo Trend: DTrend,
- 3. Pvt. Evolve: Pvt Low 123.74,
- 4. Pvt. Next: Pvt High 127.00,
- 5. Levels R: 168.12, 168.02, 167.58, 165.98, 162.12,
- 6. Levels S: 123.74.
Weekly Benchmarks
- (Short-Term) 5 Day: 125.28 Up Trend,
- (Short-Term) 10 Day: 125.31 Up Trend,
- (Intermediate-Term) 20 Day: 126.33 Down Trend,
- (Intermediate-Term) 55 Day: 127.30 Down Trend,
- (Long-Term) 100 Day: 128.86 Down Trend,
- (Long-Term) 200 Day: 130.99 Down Trend.
Recent Trade Signals
- 25 May 2026: Long FGBL 06-26 @ 126.06 Signals.USAR-WSFG
- 25 May 2026: Long FGBL 06-26 @ 125.96 Signals.USAR-MSFG
- 22 May 2026: Long FGBL 06-26 @ 125.42 Signals.USAR.TR720
- 18 May 2026: Long FGBL 06-26 @ 124.32 Signals.USAR.TR120
Overall Rating
- Short-Term: Bullish,
- Intermediate-Term: Bullish,
- Long-Term: Bearish.
Key Insights Summary
Weekly structure is trading above the weekly and monthly F0%/NTZ zones while the yearly framework remains below its centerline, creating a mixed higher-timeframe backdrop with a shorter-term rebound tone inside a broader downtrend. Price is pressing around the 126.64 area after an impulsive move off the recent 123.74 swing low, with pivot evolution still marked by DTrend but the next pivot projection pointing toward a swing high at 127.00. Short benchmarks at 5 and 10 days are aligned positively, while the 20, 55, 100, and 200 day benchmarks remain in descending bearish configuration, showing that the rally is occurring beneath a larger bearish moving-average stack. Recent long signals across WSFG, MSFG, and TR720 reinforce the current upside recovery, but the yearly session remains structurally negative, so the chart reads as a countertrend weekly advance within a longer-term decline.
Chart Analysis ATS AI Generated: 2026-05-25 07:03 for Informational use only, not trading advice. Terms and Risk Disclosure Copyright © 2026. Algo Trading Systems LLC.