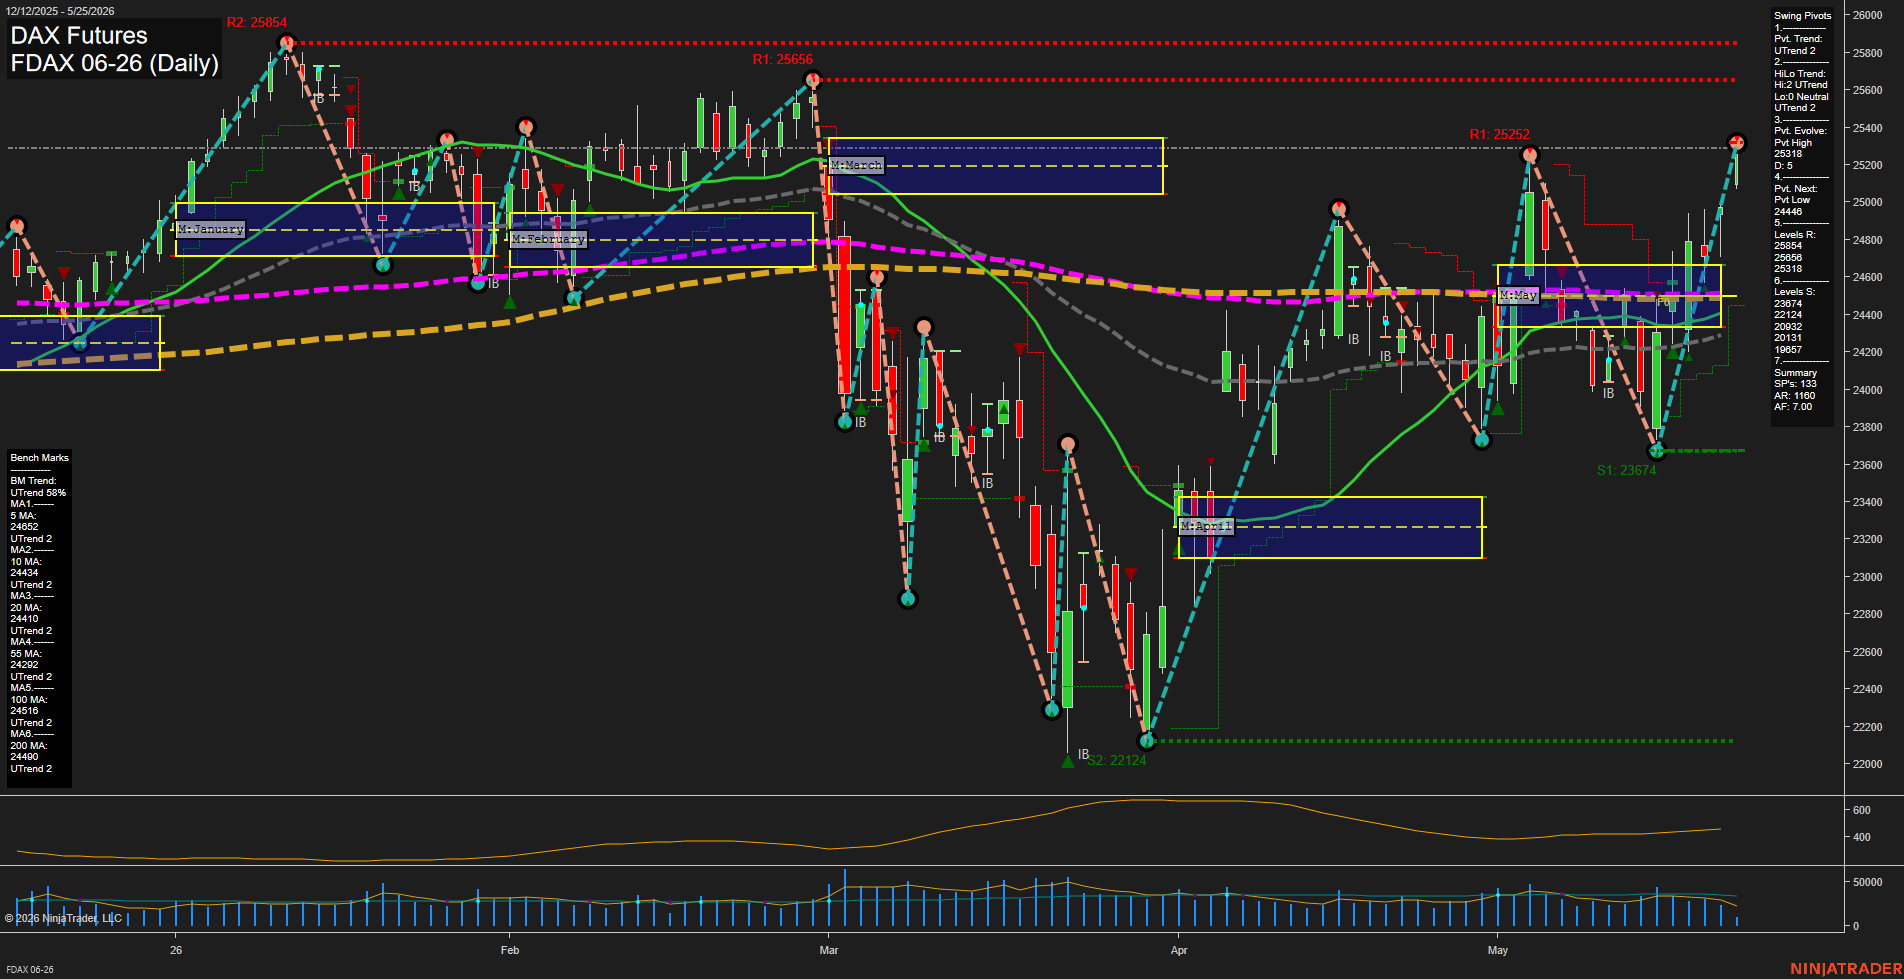
FDAX DAX Futures Daily Chart Analysis: 2026-May-25 07:03 CT
Price Action
- Last: 25318,
- Bars: Large,
- Mom: fast.
WSFG Weekly
- Short-Term
- WSFG Current: 22%
- F0%/NTZ' Bias: Price Above,
- WSFG Trend: Up.
MSFG Month May
- Intermediate-Term
- MSFG Current: 45%
- F0%/NTZ' Bias: Price Above,
- MSFG Trend: Up.
YSFG Year 2026
- Long-Term
- YSFG Current: 16%
- F0%/NTZ' Bias: Price Above,
- YSFG Trend: Up.
Swing Pivots
- (Short-Term) 1. Pvt. Trend: UTrend,
- (Intermediate-Term) 2. HiLo Trend: UTrend,
- 3. Pvt. Evolve: Pvt High 25318,
- 4. Pvt. Next: Pvt Low 24446,
- 5. Levels R: 25854, 25666, 25318,
- 6. Levels S: 23674, 22124, 20932, 20131, 19857.
Daily Benchmarks
- (Short-Term) 5 Day: 24652 Up Trend,
- (Short-Term) 10 Day: 24434 Up Trend,
- (Intermediate-Term) 20 Day: 24410 Up Trend,
- (Intermediate-Term) 55 Day: 24292 Up Trend,
- (Long-Term) 100 Day: 24516 Up Trend,
- (Long-Term) 200 Day: 24490 Up Trend.
Additional Metrics
Recent Trade Signals
- 25 May 2026: Long FDAX 06-26 @ 25226 Signals.USAR-WSFG
- 22 May 2026: Long FDAX 06-26 @ 24823 Signals.USAR-MSFG
- 18 May 2026: Long FDAX 06-26 @ 24451 Signals.USAR.TR120
Overall Rating
- Short-Term: Bullish,
- Intermediate-Term: Bullish,
- Long-Term: Bullish.
Key Insights Summary
The daily structure remains constructive, with price pressing into the upper end of the May session grid and holding above the key fib midpoint area. Swing pivots are aligned to an uptrend, with the most recent evolution confirming a fresh pivot high and the next opposite pivot still lower at 24446, which keeps the dominant sequence of higher highs and higher lows intact. All benchmark moving averages are stacked in positive trend alignment, reinforcing the broader bullish regime across short, intermediate, and long horizons. Recent long signals across WSFG, MSFG, and TR120 show continued upside participation, while the expansion in ATR supports a faster trend phase rather than a quiet consolidation. The larger context suggests a rally that has reclaimed prior retracement zones and is now testing overhead resistance near the 25318 to 25666 area, with higher resistance still mapped at 25854.
Chart Analysis ATS AI Generated: 2026-05-25 07:03 for Informational use only, not trading advice. Terms and Risk Disclosure Copyright © 2026. Algo Trading Systems LLC.