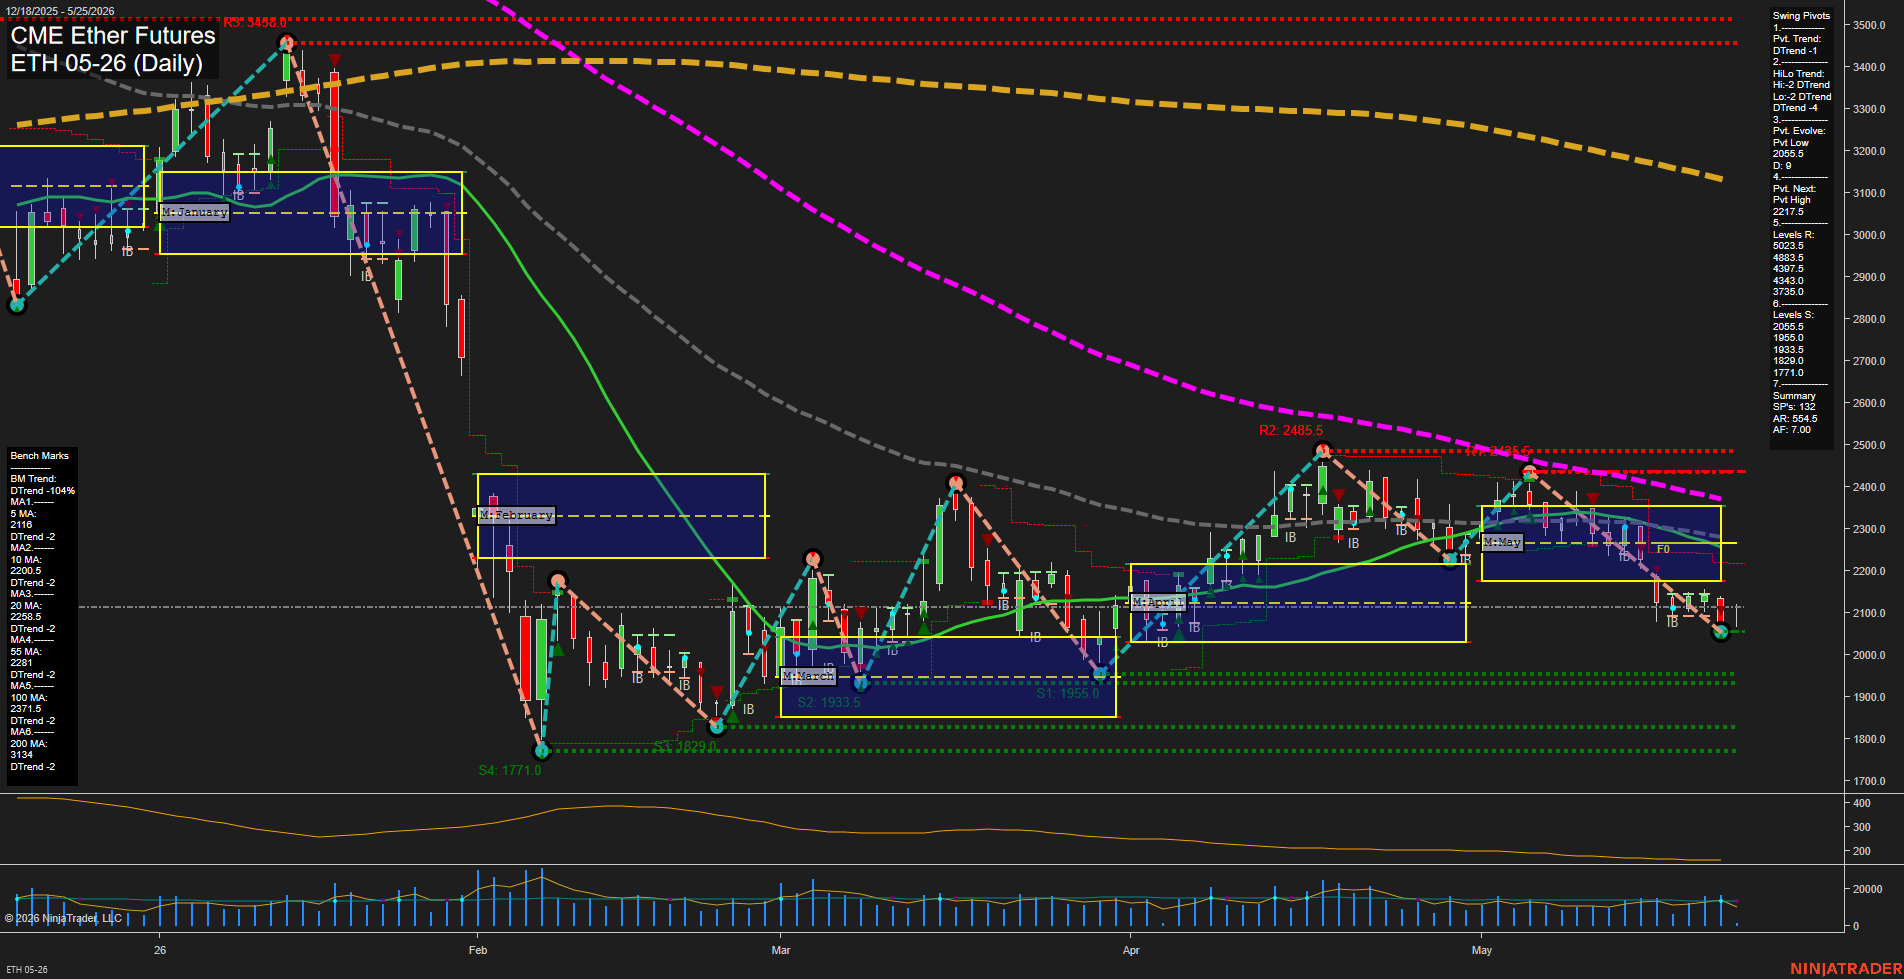
ETH CME Ether Futures Daily Chart Analysis: 2026-May-25 07:02 CT
Price Action
- Last: 2055.5,
- Bars: Medium,
- Mom: Slow.
WSFG Weekly
- Short-Term
- WSFG Current: 30%
- F0%/NTZ' Bias: Price Above,
- WSFG Trend: Up.
MSFG Month May
- Intermediate-Term
- MSFG Current: -35%
- F0%/NTZ' Bias: Price Below,
- MSFG Trend: Down.
YSFG Year 2026
- Long-Term
- YSFG Current: -34%
- F0%/NTZ' Bias: Price Below,
- YSFG Trend: Down.
Swing Pivots
- (Short-Term) 1. Pvt. Trend: DTrend,
- (Intermediate-Term) 2. HiLo Trend: DTrend,
- 3. Pvt. Evolve: Pvt Low 2055.5,
- 4. Pvt. Next: Pvt High 2217.5,
- 5. Levels R: 5023.5, 4883.5, 4397.5, 4343.0, 3733.5,
- 6. Levels S: 2055.5, 1955.0, 1933.5, 1829.0, 1771.0.
Daily Benchmarks
- (Short-Term) 5 Day: 2116 Down Trend,
- (Short-Term) 10 Day: 2200.5 Down Trend,
- (Intermediate-Term) 20 Day: 2258.5 Down Trend,
- (Intermediate-Term) 55 Day: 2281 Down Trend,
- (Long-Term) 100 Day: 2371.5 Down Trend,
- (Long-Term) 200 Day: 3134 Down Trend.
Additional Metrics
Recent Trade Signals
- 18 May 2026: Short ETH 05-26 @ 2119.5 Signals.USAR.TR720
Overall Rating
- Short-Term: Bearish,
- Intermediate-Term: Bearish,
- Long-Term: Bearish.
Key Insights Summary
ETH CME Ether Futures remain in a broad corrective/downtrend structure, with price pressing near the lower edge of the May monthly session fib grid and sitting below the key daily benchmark averages. The pivot structure is still aligned to downside follow-through, with the latest pivot evolving from a lower low and the next confirmed opposite pivot marked above at 2217.5. Monthly and yearly session fib trends are both negative, reinforcing an intermediate-to-long-term bearish backdrop. The recent sequence shows a failed recovery into the 2400s followed by lower highs and a drift back toward the 2050 support zone, leaving the market in a weak consolidation-to-downtrend posture with bearish momentum dominant.
Chart Analysis ATS AI Generated: 2026-05-25 07:02 for Informational use only, not trading advice. Terms and Risk Disclosure Copyright © 2026. Algo Trading Systems LLC.