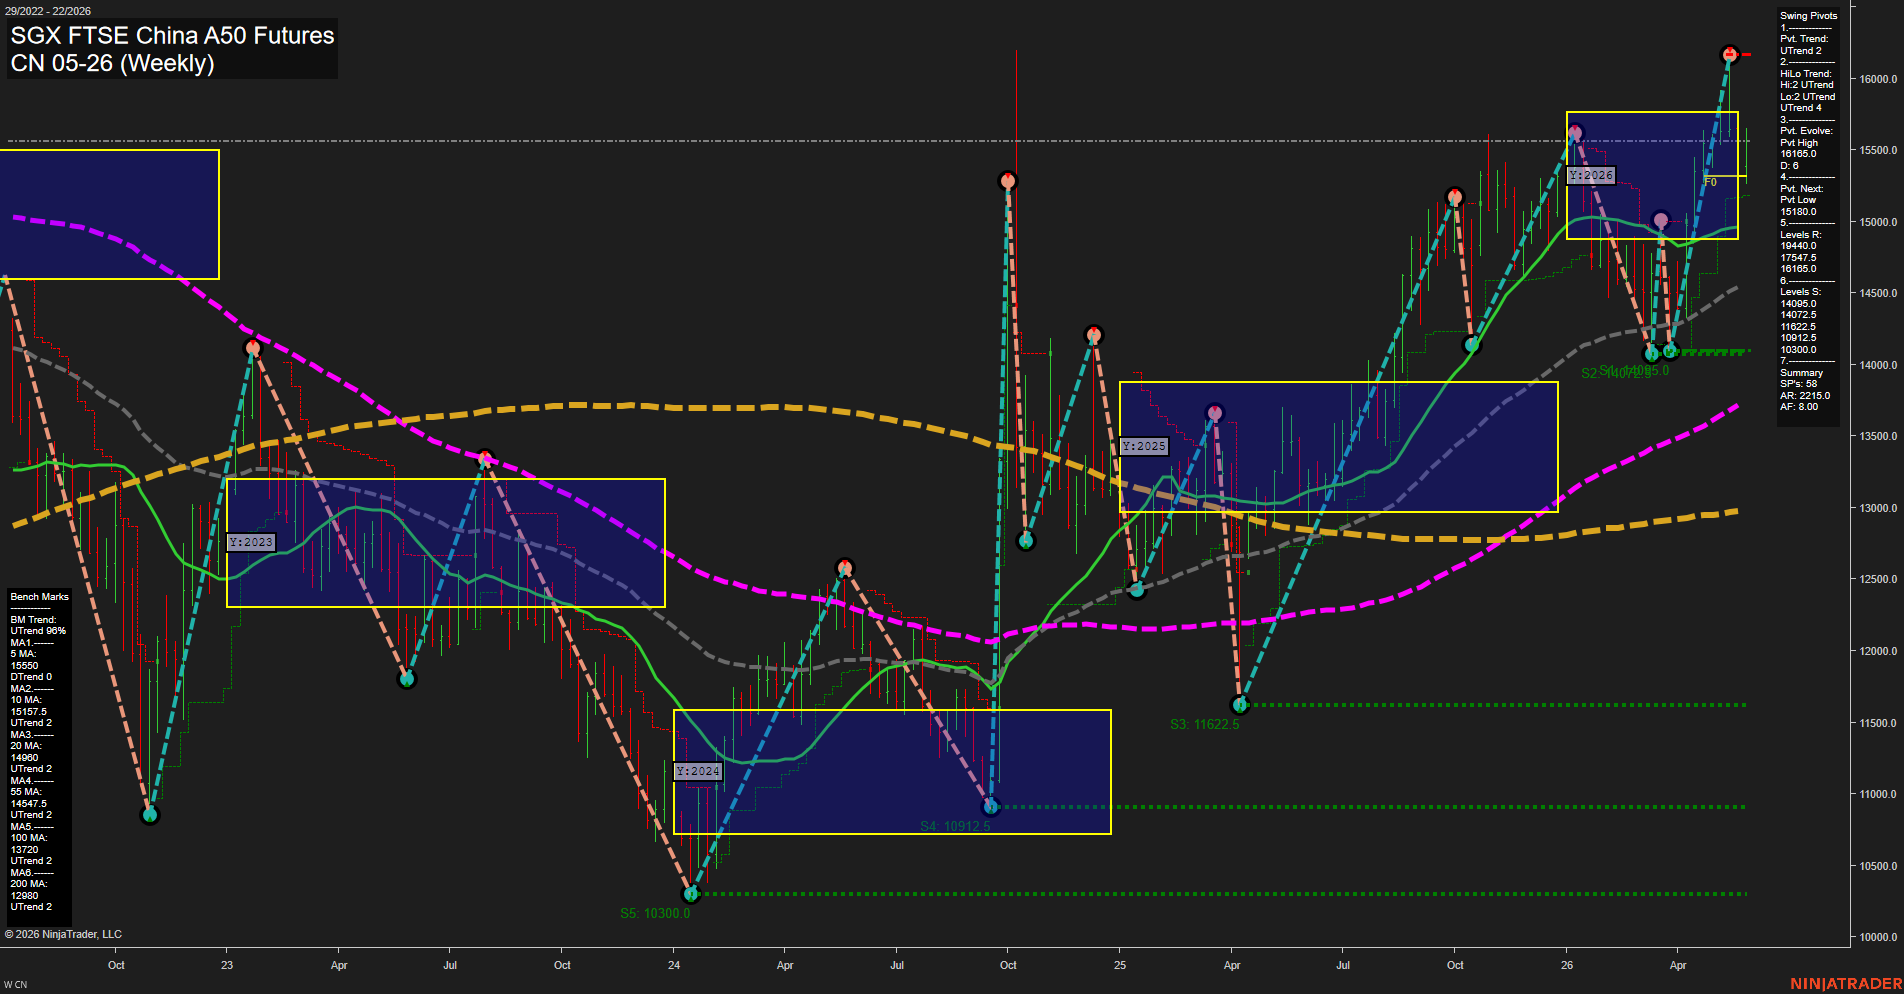
CN SGX FTSE China A50 Futures Weekly Chart Analysis: 2026-May-25 07:02 CT
Price Action
- Last: 16165.0,
- Bars: Large,
- Mom: fast.
WSFG Weekly
- Short-Term
- WSFG Current: NA%
- F0%/NTZ' Bias: Price Neutral,
- WSFG Trend: Neutral.
MSFG Month May
- Intermediate-Term
- MSFG Current: NA%
- F0%/NTZ' Bias: Price Neutral,
- MSFG Trend: Neutral.
YSFG Year 2026
- Long-Term
- YSFG Current: NA%
- F0%/NTZ' Bias: Price Neutral,
- YSFG Trend: Neutral.
Swing Pivots
- (Short-Term) 1. Pvt. Trend: UTrend,
- (Intermediate-Term) 2. HiLo Trend: UTrend,
- 3. Pvt. Evolve: Pvt High 16165.0,
- 4. Pvt. Next: Pvt Low 15180.0,
- 5. Levels R: 19440.0, 17547.5, 16165.0,
- 6. Levels S: 14905.0, 14072.5, 11622.5, 10912.5, 10300.0.
Weekly Benchmarks
- (Short-Term) 5 Day: 15550.0 Down Trend,
- (Short-Term) 10 Day: 15157.5 Up Trend,
- (Intermediate-Term) 20 Day: 14960.0 Up Trend,
- (Intermediate-Term) 55 Day: 14547.5 Up Trend,
- (Long-Term) 100 Day: 13720.0 Up Trend,
- (Long-Term) 200 Day: 12880.0 Up Trend.
Overall Rating
- Short-Term: Bullish,
- Intermediate-Term: Bullish,
- Long-Term: Bullish.
Key Insights Summary
Weekly price is pressing into a fresh swing-high zone at 16165 after a strong multi-month advance, with large weekly bars and fast momentum showing an impulsive move rather than a slow grind. The pivot structure remains in UTrend on both the short-term and HiLo measures, and the benchmark stack is broadly constructive with price holding above the 10, 20, 55, 100, and 200 day averages; only the 5-day benchmark is still marked down, reflecting a short-term extension after a sharp rally. The broader trend map shows a completed sequence of higher highs and higher lows from the 2024 base through the 2025 recovery and into the 2026 breakout phase, with resistance now concentrated at 17547.5 and 19440.0 and support layered below at 14905.0, 14072.5, 11622.5, 10912.5, and 10300.0. Overall, the chart reads as a bullish trending futures structure with strong weekly trend continuation behavior and elevated price expansion near the upper end of the yearly session range.
Chart Analysis ATS AI Generated: 2026-05-25 07:02 for Informational use only, not trading advice. Terms and Risk Disclosure Copyright © 2026. Algo Trading Systems LLC.