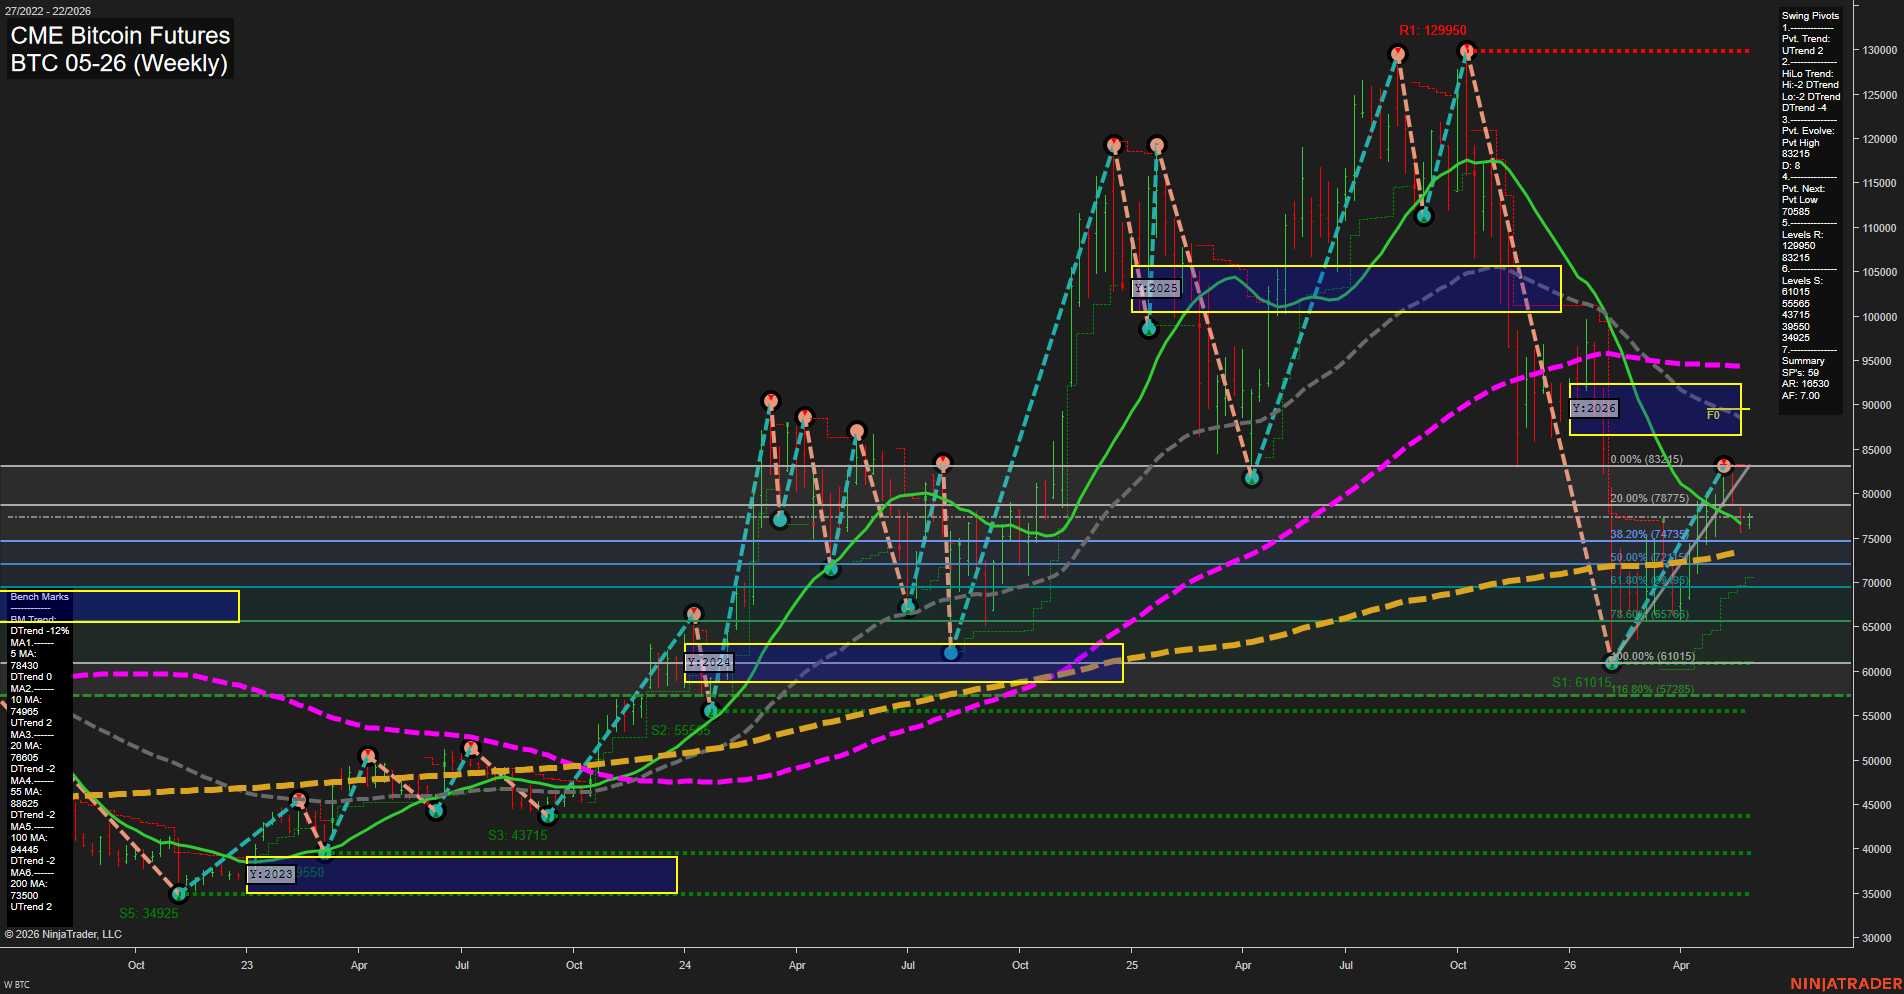
BTC CME Bitcoin Futures Weekly Chart Analysis: 2026-May-25 07:01 CT
Price Action
- Last: 78300,
- Bars: Medium,
- Mom: average.
WSFG Weekly
- Short-Term
- WSFG Current: 28%
- F0%/NTZ' Bias: Price Above,
- WSFG Trend: Up.
MSFG Month May
- Intermediate-Term
- MSFG Current: -1%
- F0%/NTZ' Bias: Price Below,
- MSFG Trend: Down.
YSFG Year 2026
- Long-Term
- YSFG Current: -42%
- F0%/NTZ' Bias: Price Below,
- YSFG Trend: Down.
Swing Pivots
- (Short-Term) 1. Pvt. Trend: UTrend,
- (Intermediate-Term) 2. HiLo Trend: Hi-2 DTrend, Lo-2 DTrend,
- 3. Pvt. Evolve: Pvt High 83215,
- 4. Pvt. Next: Pvt Low 70585,
- 5. Levels R: 129950, 83215,
- 6. Levels S: 61015, 55665, 43715, 39550, 34925.
Weekly Benchmarks
- (Short-Term) 5 Day: 78430 Down Trend,
- (Short-Term) 10 Day: 74965 Down Trend,
- (Intermediate-Term) 20 Day: 78605 Up Trend,
- (Intermediate-Term) 55 Day: 88625 Down Trend,
- (Long-Term) 100 Day: 94445 Down Trend,
- (Long-Term) 200 Day: 73500 Up Trend.
Recent Trade Signals
- 22 May 2026: Short BTC 05-26 @ 75815 Signals.USAR-MSFG
- 21 May 2026: Short BTC 05-26 @ 77355 Signals.USAR-WSFG
- 18 May 2026: Short BTC 05-26 @ 76390 Signals.USAR.TR720
Overall Rating
- Short-Term: Neutral,
- Intermediate-Term: Bearish,
- Long-Term: Bearish.
Key Insights Summary
Price is rebounding off the deep 2026 selloff but remains below the yearly and monthly fib midlines, leaving the broader structure in a corrective downtrend. The weekly session grid is constructive and price is holding above the weekly F0/NTZ band, which supports a short-term uptrend with a medium momentum profile. Swing pivots still show an active upward short-term pivot sequence, but the intermediate pivot structure remains mixed to bearish after the failed high and sharp retracement from the 129950 resistance area. Benchmarks are split, with price near the 5-day and 20-day means but still under the 55-day and 100-day averages, reflecting a recovery attempt inside a larger bearish framework. Recent short signals across WSFG, MSFG, and TR720 align with the broader downside pressure, while the current bounce is behaving like a retracement toward overhead resistance rather than a confirmed long-term trend reversal.
Chart Analysis ATS AI Generated: 2026-05-25 07:01 for Informational use only, not trading advice. Terms and Risk Disclosure Copyright © 2026. Algo Trading Systems LLC.