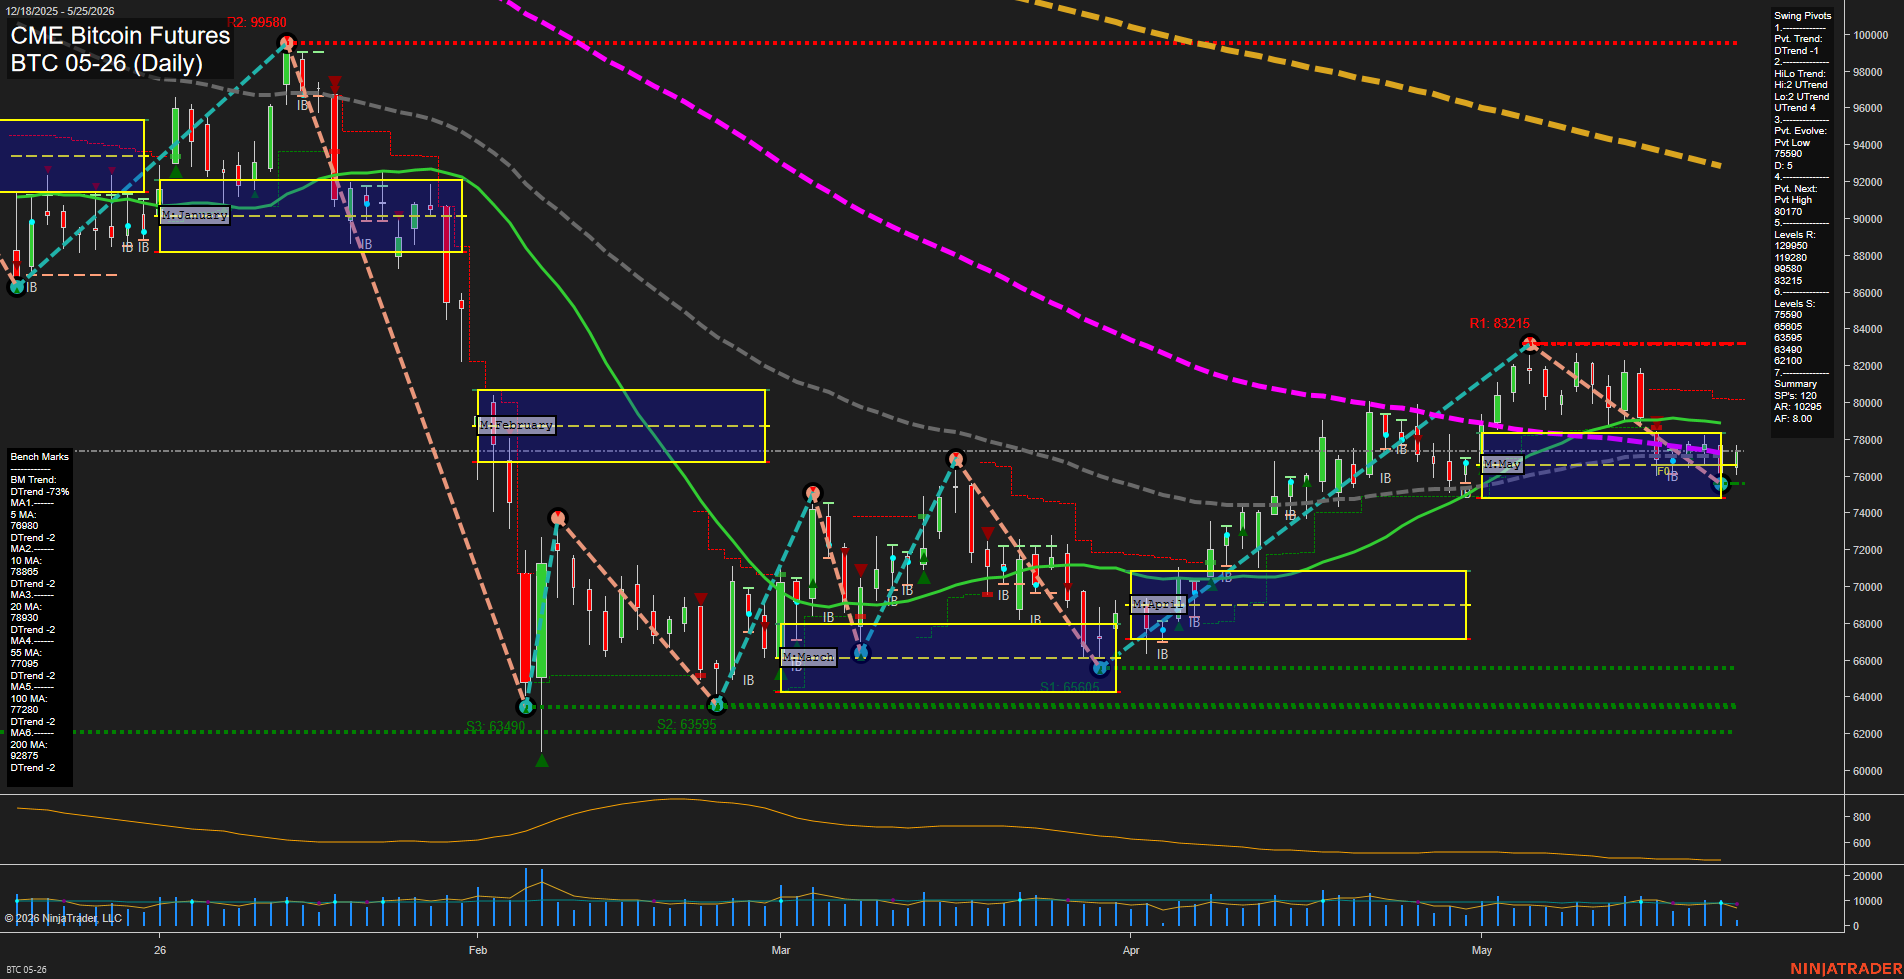
BTC CME Bitcoin Futures Daily Chart Analysis: 2026-May-25 07:01 CT
Price Action
- Last: 76000,
- Bars: Medium,
- Mom: average.
WSFG Weekly
- Short-Term
- WSFG Current: 28%
- F0%/NTZ' Bias: Price Above,
- WSFG Trend: Up.
MSFG Month May
- Intermediate-Term
- MSFG Current: -1%
- F0%/NTZ' Bias: Price Below,
- MSFG Trend: Down.
YSFG Year 2026
- Long-Term
- YSFG Current: -42%
- F0%/NTZ' Bias: Price Below,
- YSFG Trend: Down.
Swing Pivots
- (Short-Term) 1. Pvt. Trend: DTrend,
- (Intermediate-Term) 2. HiLo Trend: UTrend,
- 3. Pvt. Evolve: Pvt Low 75590,
- 4. Pvt. Next: Pvt High 80170,
- 5. Levels R: 129950, 119280, 99580, 83215,
- 6. Levels S: 75590, 65605, 63595, 63490, 62100.
Daily Benchmarks
- (Short-Term) 5 Day: 76980 Down Trend,
- (Short-Term) 10 Day: 78865 Down Trend,
- (Intermediate-Term) 20 Day: 78930 Down Trend,
- (Intermediate-Term) 55 Day: 77095 Down Trend,
- (Long-Term) 100 Day: 77280 Down Trend,
- (Long-Term) 200 Day: 92875 Down Trend.
Additional Metrics
- ATR: 10295,
- VOLMA: 15061.
Recent Trade Signals
- 22 May 2026: Short BTC 05-26 @ 75815 Signals.USAR-MSFG
- 21 May 2026: Short BTC 05-26 @ 77355 Signals.USAR-WSFG
- 18 May 2026: Short BTC 05-26 @ 76390 Signals.USAR.TR720
Overall Rating
- Short-Term: Bearish,
- Intermediate-Term: Bearish,
- Long-Term: Bearish.
Key Insights Summary
Bitcoin futures are sitting near the lower edge of the May monthly fib box after failing to sustain the early-May rally toward the 83,215 resistance area. The daily pivot structure remains in a short-term downtrend with price beneath the 5, 10, 20, 55, 100, and 200 day benchmarks, while the intermediate HiLo pivot trend still leans constructive from the prior swing sequence. Weekly structure remains positive above its midpoint, but the monthly and yearly grids are still below F0%, keeping the broader tape aligned with a downtrend and a retracement/rejection posture. The chart shows a sequence of lower highs from the recent 83k peak and repeated tests around the mid-to-upper 70k zone, with 75,590 acting as the key nearby swing-low reference and 80,170 as the next pivot high reference. Momentum has cooled from the spring recovery and current price action looks like consolidation after a failed extension, with recent short signals confirming the bearish monthly and weekly grid reactions.
Chart Analysis ATS AI Generated: 2026-05-25 07:01 for Informational use only, not trading advice. Terms and Risk Disclosure Copyright © 2026. Algo Trading Systems LLC.