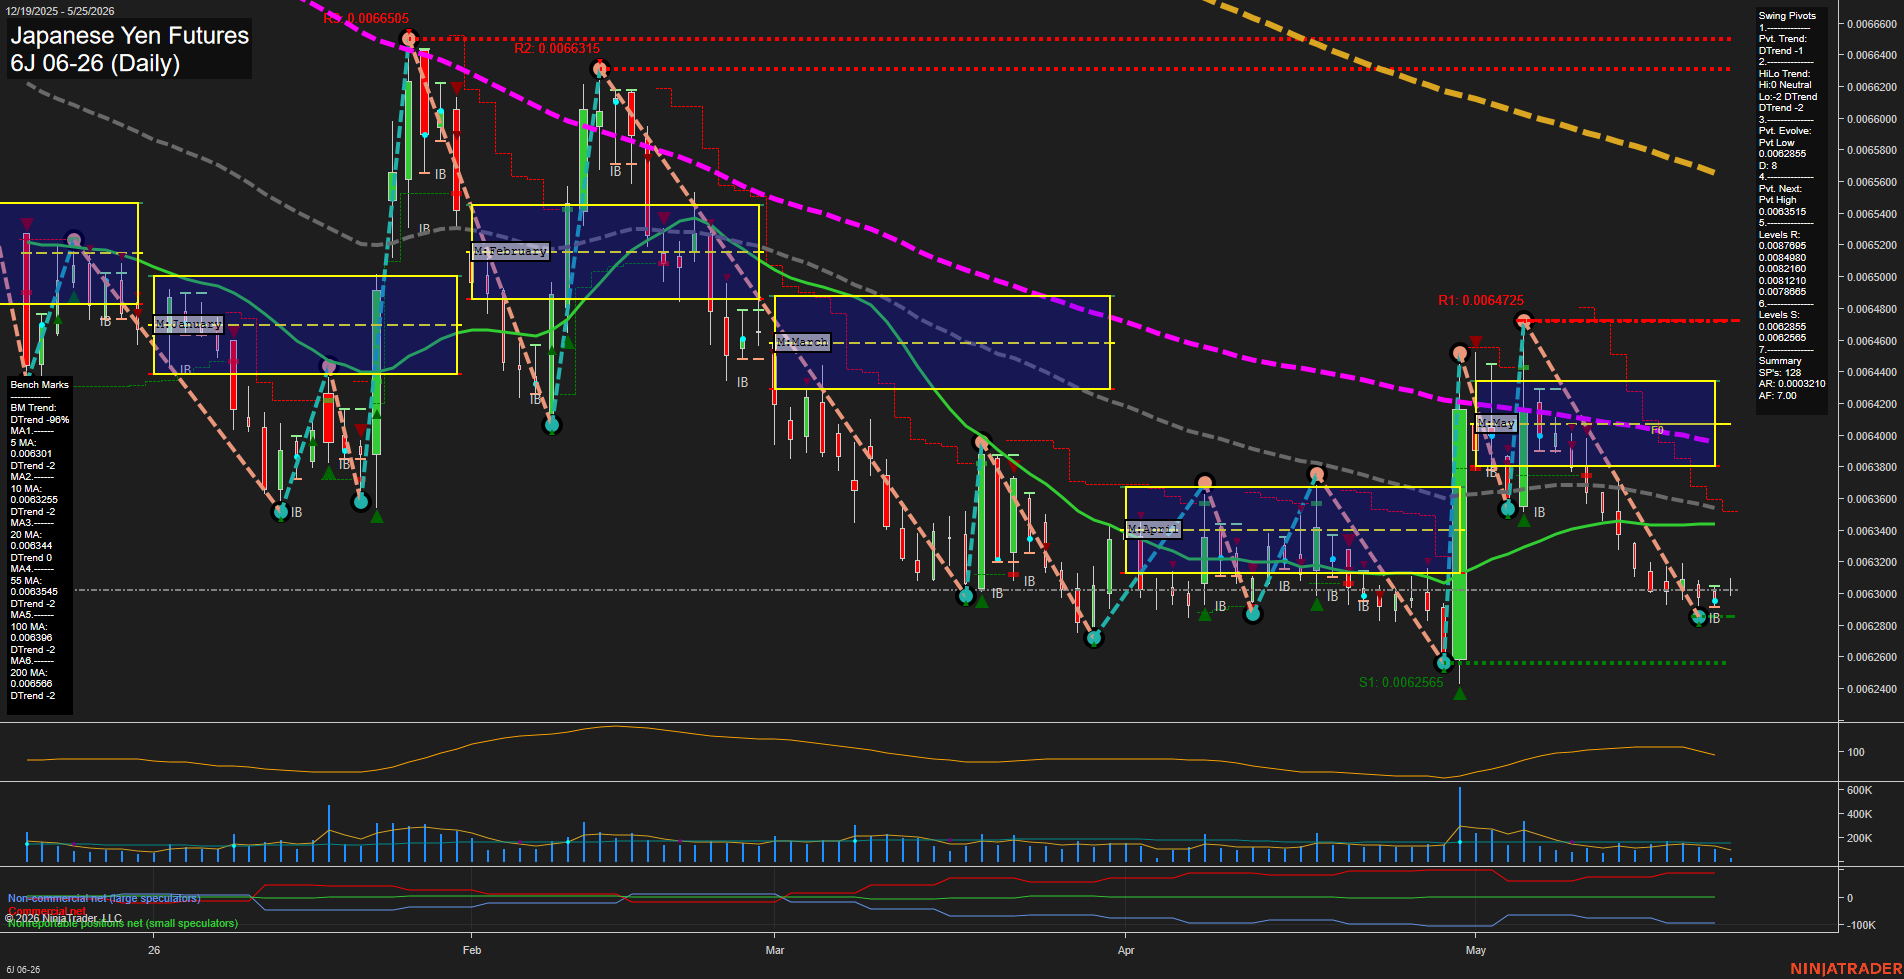
6J Japanese Yen Futures Daily Chart Analysis: 2026-May-25 07:01 CT
Price Action
- Last: 0.006301,
- Bars: Medium,
- Mom: average.
WSFG Weekly
- Short-Term
- WSFG Current: 2%
- F0%/NTZ' Bias: Price Above,
- WSFG Trend: Up.
MSFG Month May
- Intermediate-Term
- MSFG Current: -43%
- F0%/NTZ' Bias: Price Below,
- MSFG Trend: Down.
YSFG Year 2026
- Long-Term
- YSFG Current: -14%
- F0%/NTZ' Bias: Price Below,
- YSFG Trend: Down.
Swing Pivots
- (Short-Term) 1. Pvt. Trend: DTrend,
- (Intermediate-Term) 2. HiLo Trend: DTrend,
- 3. Pvt. Evolve: Pvt Low 0.0062855,
- 4. Pvt. Next: Pvt High 0.0063515,
- 5. Levels R: 0.0067895, 0.0084980, 0.0082160, 0.0081210, 0.0078685,
- 6. Levels S: 0.0062855, 0.0062555.
Daily Benchmarks
- (Short-Term) 5 Day: 0.006301 Down Trend,
- (Short-Term) 10 Day: 0.0063255 Down Trend,
- (Intermediate-Term) 20 Day: 0.006344 Down Trend,
- (Intermediate-Term) 55 Day: 0.0063545 Down Trend,
- (Long-Term) 100 Day: 0.0063986 Down Trend,
- (Long-Term) 200 Day: 0.006566 Down Trend.
Additional Metrics
Recent Trade Signals
- 22 May 2026: Short 6J 06-26 @ 0.006298 Signals.USAR-WSFG
Overall Rating
- Short-Term: Bearish,
- Intermediate-Term: Bearish,
- Long-Term: Bearish.
Key Insights Summary
6J remains in a broader downside trend with the daily structure still aligned below all benchmark moving averages, and the pivot framework pointing to DTrend on both the short-term pivot and the hi/lo sequence. Price is trading near the lower band of the May MSFG zone after the sharp May rebound failed to hold above the mid-range and rolled back into the lower half of the month’s fib grid. The weekly session bias is still positive above its F0%/NTZ reference, but the daily chart is not confirming that strength, leaving the tape in a countertrend rebound-to-rollover posture. The pivot map shows nearby resistance layered overhead while support is concentrated around the recent low area near 0.0062855, with the broader trend still capped by declining 20, 55, 100, and 200 day benchmarks. Recent candles show a compressed, choppy retracement after the May spike, followed by renewed weakness and lower highs, which keeps the swing profile tilted bearish across the short, intermediate, and long horizons.
Chart Analysis ATS AI Generated: 2026-05-25 07:01 for Informational use only, not trading advice. Terms and Risk Disclosure Copyright © 2026. Algo Trading Systems LLC.