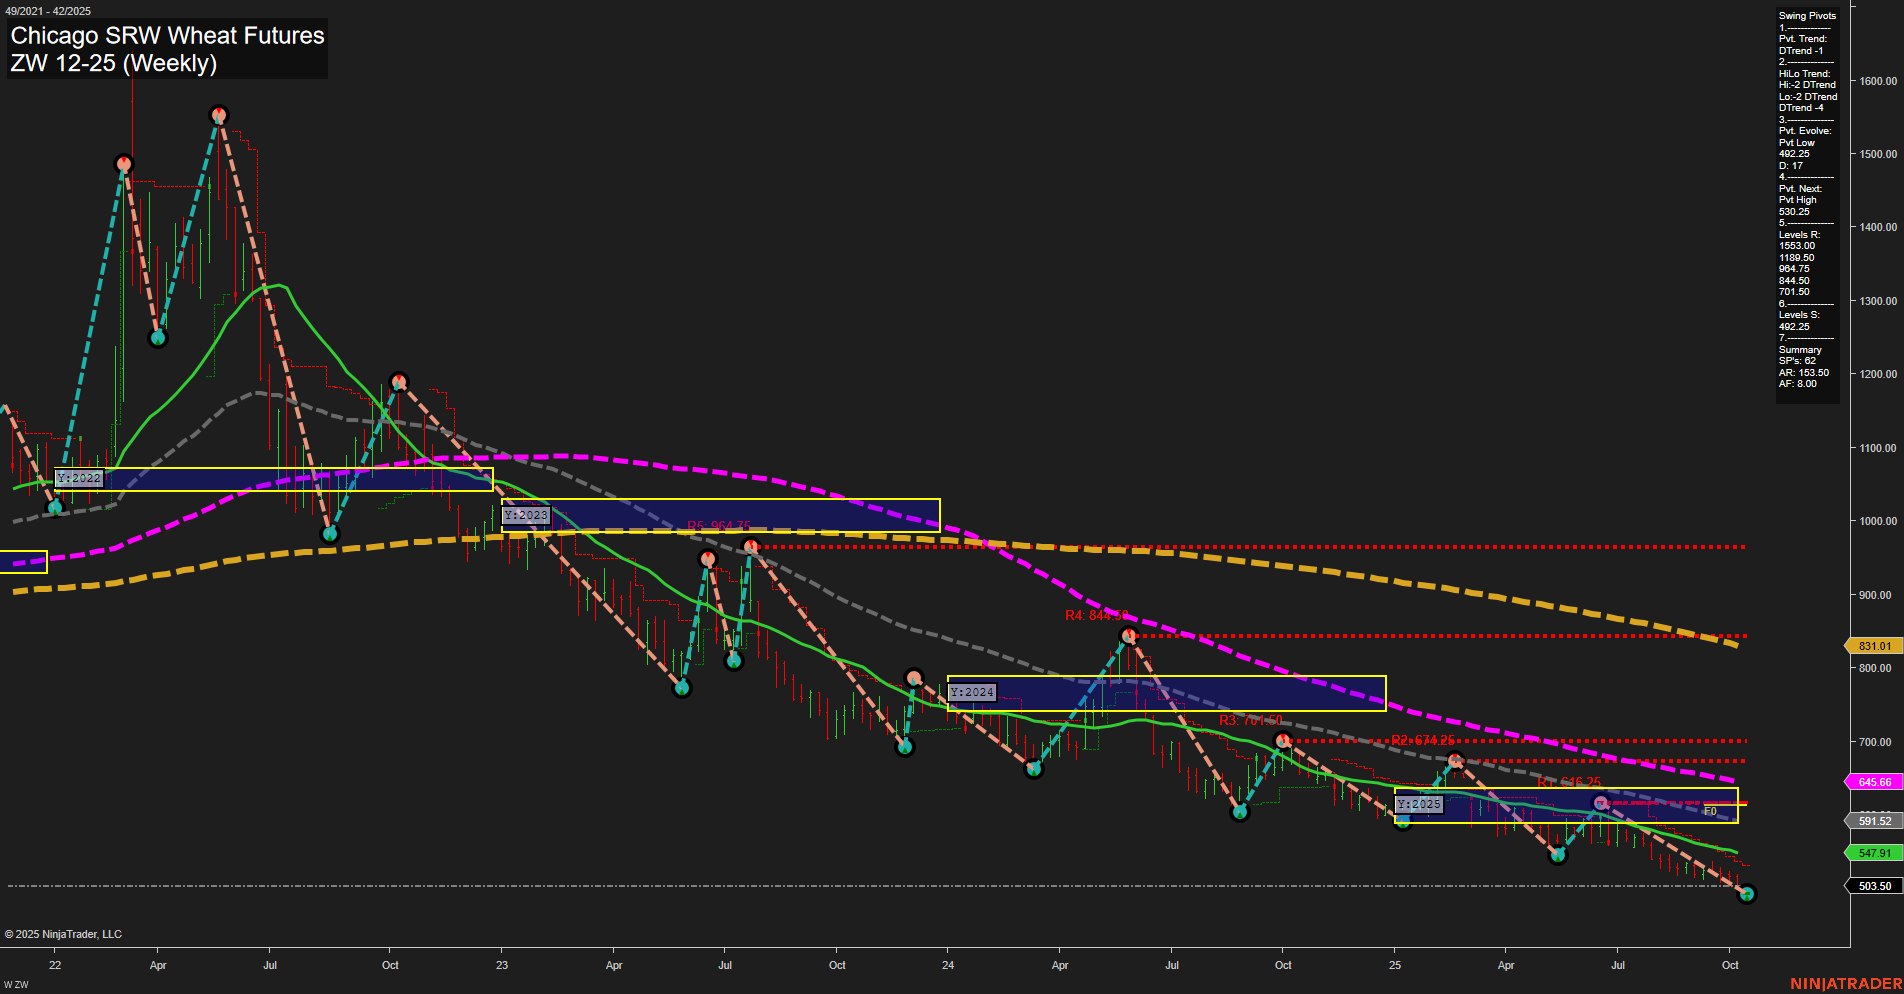
ZW Chicago SRW Wheat Futures Weekly Chart Analysis: 2025-Oct-17 07:24 CT
Price Action
- Last: 503.50,
- Bars: Small,
- Mom: Momentum slow.
WSFG Weekly
- Short-Term
- WSFG Current: 23%
- F0%/NTZ' Bias: Price Above,
- WSFG Trend: Up.
MSFG Month Oct
- Intermediate-Term
- MSFG Current: -7%
- F0%/NTZ' Bias: Price Below,
- MSFG Trend: Down.
YSFG Year 2025
- Long-Term
- YSFG Current: -46%
- F0%/NTZ' Bias: Price Below,
- YSFG Trend: Down.
Swing Pivots
- (Short-Term) 1. Pvt. Trend: DTrend,
- (Intermediate-Term) 2. HiLo Trend: DTrend,
- 3. Pvt. Evolve: Pvt low 502.25,
- 4. Pvt. Next: Pvt high 630.25,
- 5. Levels R: 1183.00, 1048.50, 944.75, 844.00, 701.50, 630.25,
- 6. Levels S: 502.25.
Weekly Benchmarks
- (Intermediate-Term) 5 Week: 547.91 Down Trend,
- (Intermediate-Term) 10 Week: 591.52 Down Trend,
- (Long-Term) 20 Week: 645.66 Down Trend,
- (Long-Term) 55 Week: 831.01 Down Trend,
- (Long-Term) 100 Week: 0.00,
- (Long-Term) 200 Week: 0.00.
Recent Trade Signals
- 16 Oct 2025: Long ZW 12-25 @ 501 Signals.USAR.TR120
- 14 Oct 2025: Long ZW 12-25 @ 500.75 Signals.USAR-WSFG
- 13 Oct 2025: Short ZW 12-25 @ 498.75 Signals.USAR-MSFG
Overall Rating
- Short-Term: Neutral,
- Intermediate-Term: Bearish,
- Long-Term: Bearish.
Key Insights Summary
The ZW Chicago SRW Wheat Futures market remains in a pronounced long-term and intermediate-term downtrend, as confirmed by the negative YSFG and MSFG trends, persistent lower swing highs and lows, and all major moving averages trending downward. The most recent price action shows small bars and slow momentum, indicating a lack of strong conviction or volatility at current levels. While the short-term WSFG trend has turned up with price slightly above the NTZ center, this is countered by the prevailing downtrend in both swing pivots and benchmarks. Recent trade signals show mixed short-term activity, with both long and short entries, reflecting a potential attempt at a short-term bounce or consolidation near major support at 502.25. However, with resistance levels stacked above and no significant moving average support, the overall structure favors continued caution for sustained upside until a clear reversal pattern or breakout above key resistance levels emerges. The market is currently testing major support, and any failure to hold could see further downside continuation in line with the dominant trend.
Chart Analysis ATS AI Generated: 2025-10-17 07:25 for Informational use only, not trading advice. Terms and Risk Disclosure Copyright © 2025. Algo Trading Systems LLC.
