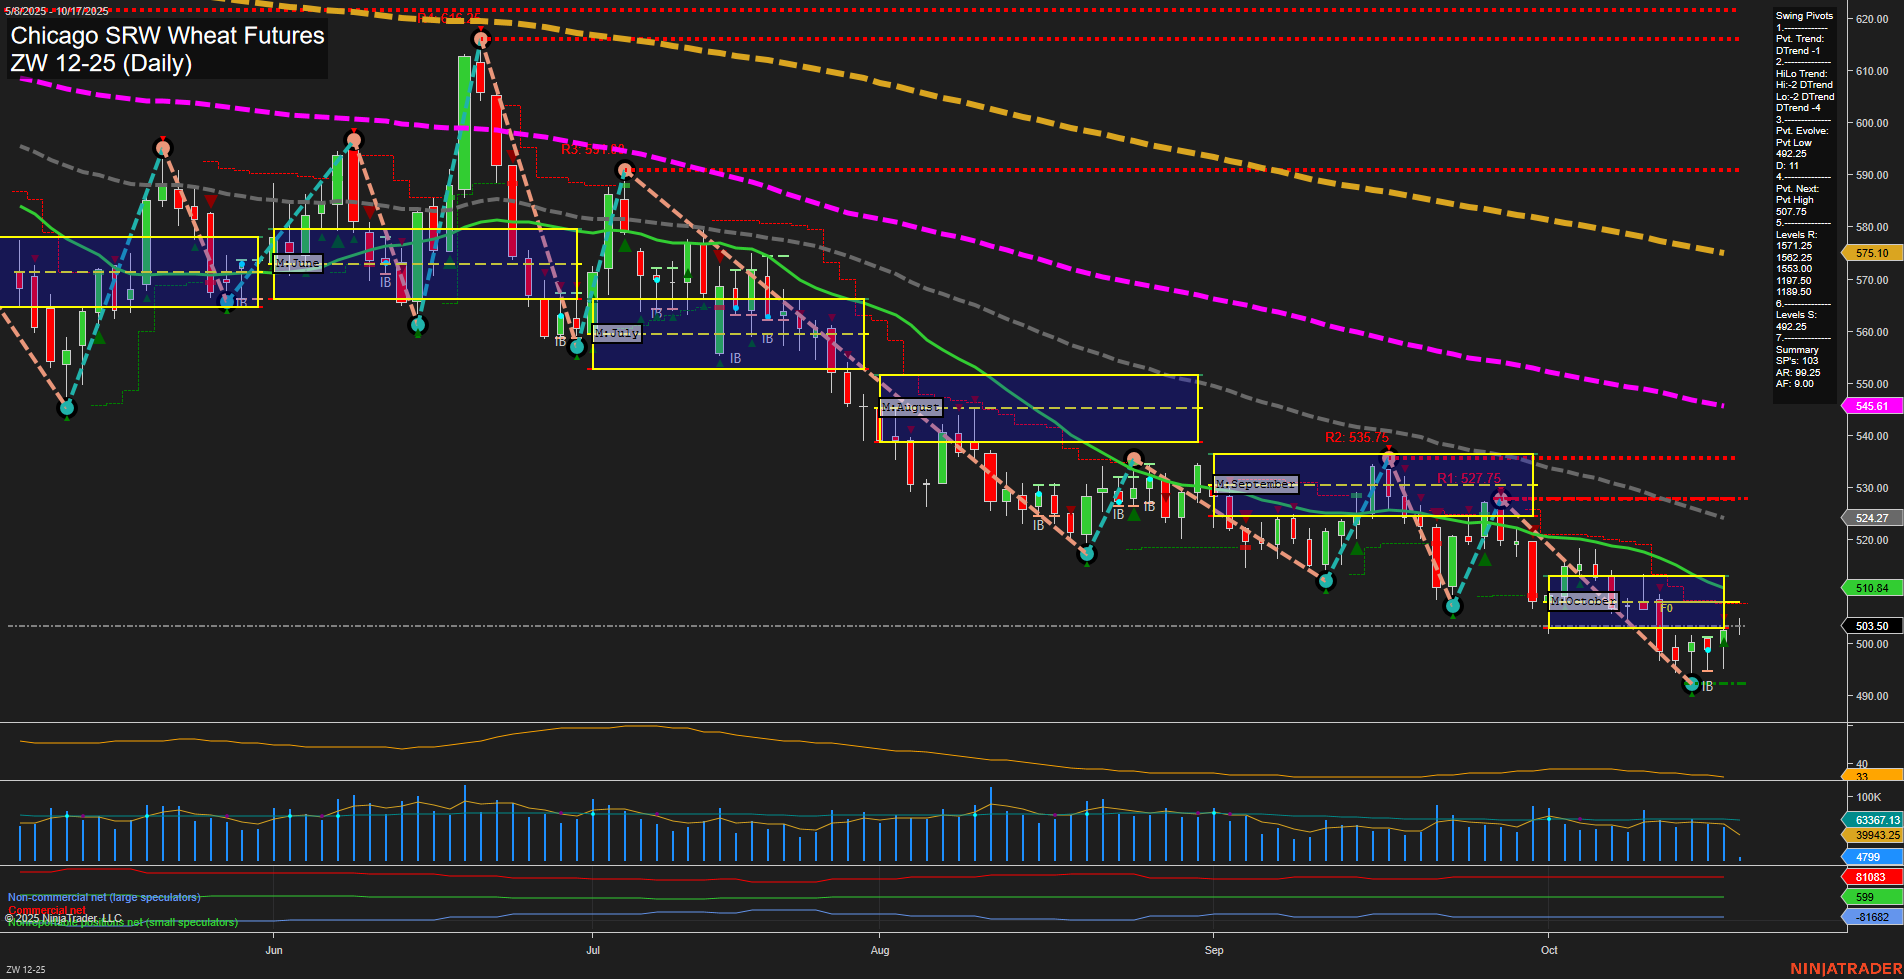
ZW Chicago SRW Wheat Futures Daily Chart Analysis: 2025-Oct-17 07:24 CT
Price Action
- Last: 503.50,
- Bars: Medium,
- Mom: Momentum slow.
WSFG Weekly
- Short-Term
- WSFG Current: 23%
- F0%/NTZ' Bias: Price Above,
- WSFG Trend: Up.
MSFG Month Oct
- Intermediate-Term
- MSFG Current: -7%
- F0%/NTZ' Bias: Price Below,
- MSFG Trend: Down.
YSFG Year 2025
- Long-Term
- YSFG Current: -46%
- F0%/NTZ' Bias: Price Below,
- YSFG Trend: Down.
Swing Pivots
- (Short-Term) 1. Pvt. Trend: DTrend,
- (Intermediate-Term) 2. HiLo Trend: DTrend,
- 3. Pvt. Evolve: Pvt Low 492.25,
- 4. Pvt. Next: Pvt High 507.75,
- 5. Levels R: 527.75, 535.75, 575.10,
- 6. Levels S: 492.25.
Daily Benchmarks
- (Short-Term) 5 Day: 499.36 Down Trend,
- (Short-Term) 10 Day: 503.26 Down Trend,
- (Intermediate-Term) 20 Day: 510.84 Down Trend,
- (Intermediate-Term) 55 Day: 524.27 Down Trend,
- (Long-Term) 100 Day: 545.61 Down Trend,
- (Long-Term) 200 Day: 575.10 Down Trend.
Additional Metrics
Recent Trade Signals
- 16 Oct 2025: Long ZW 12-25 @ 501 Signals.USAR.TR120
- 14 Oct 2025: Long ZW 12-25 @ 500.75 Signals.USAR-WSFG
- 13 Oct 2025: Short ZW 12-25 @ 498.75 Signals.USAR-MSFG
Overall Rating
- Short-Term: Neutral,
- Intermediate-Term: Bearish,
- Long-Term: Bearish.
Key Insights Summary
The ZW Chicago SRW Wheat Futures daily chart shows a market that remains under pressure, with the dominant trend still to the downside across intermediate and long-term timeframes. Price action is consolidating near recent lows, with slow momentum and medium-sized bars, suggesting a pause after a persistent decline. The short-term WSFG trend has turned up, and recent trade signals indicate some attempts at a bounce, but the overall structure is still defined by lower highs and lower lows. All key moving averages (from 5-day to 200-day) are trending down, reinforcing the prevailing bearish sentiment. Swing pivot analysis highlights resistance at 507.75 and 527.75, with support at 492.25. Volatility remains moderate, and volume is steady, but there is no clear evidence of a major reversal. The market is in a potential basing phase, but confirmation of a sustained recovery is lacking as price remains below key monthly and yearly fib grid levels. Swing traders will note the short-term neutral tone, but the broader context remains bearish until a decisive break above resistance and moving averages occurs.
Chart Analysis ATS AI Generated: 2025-10-17 07:24 for Informational use only, not trading advice. Terms and Risk Disclosure Copyright © 2025. Algo Trading Systems LLC.
