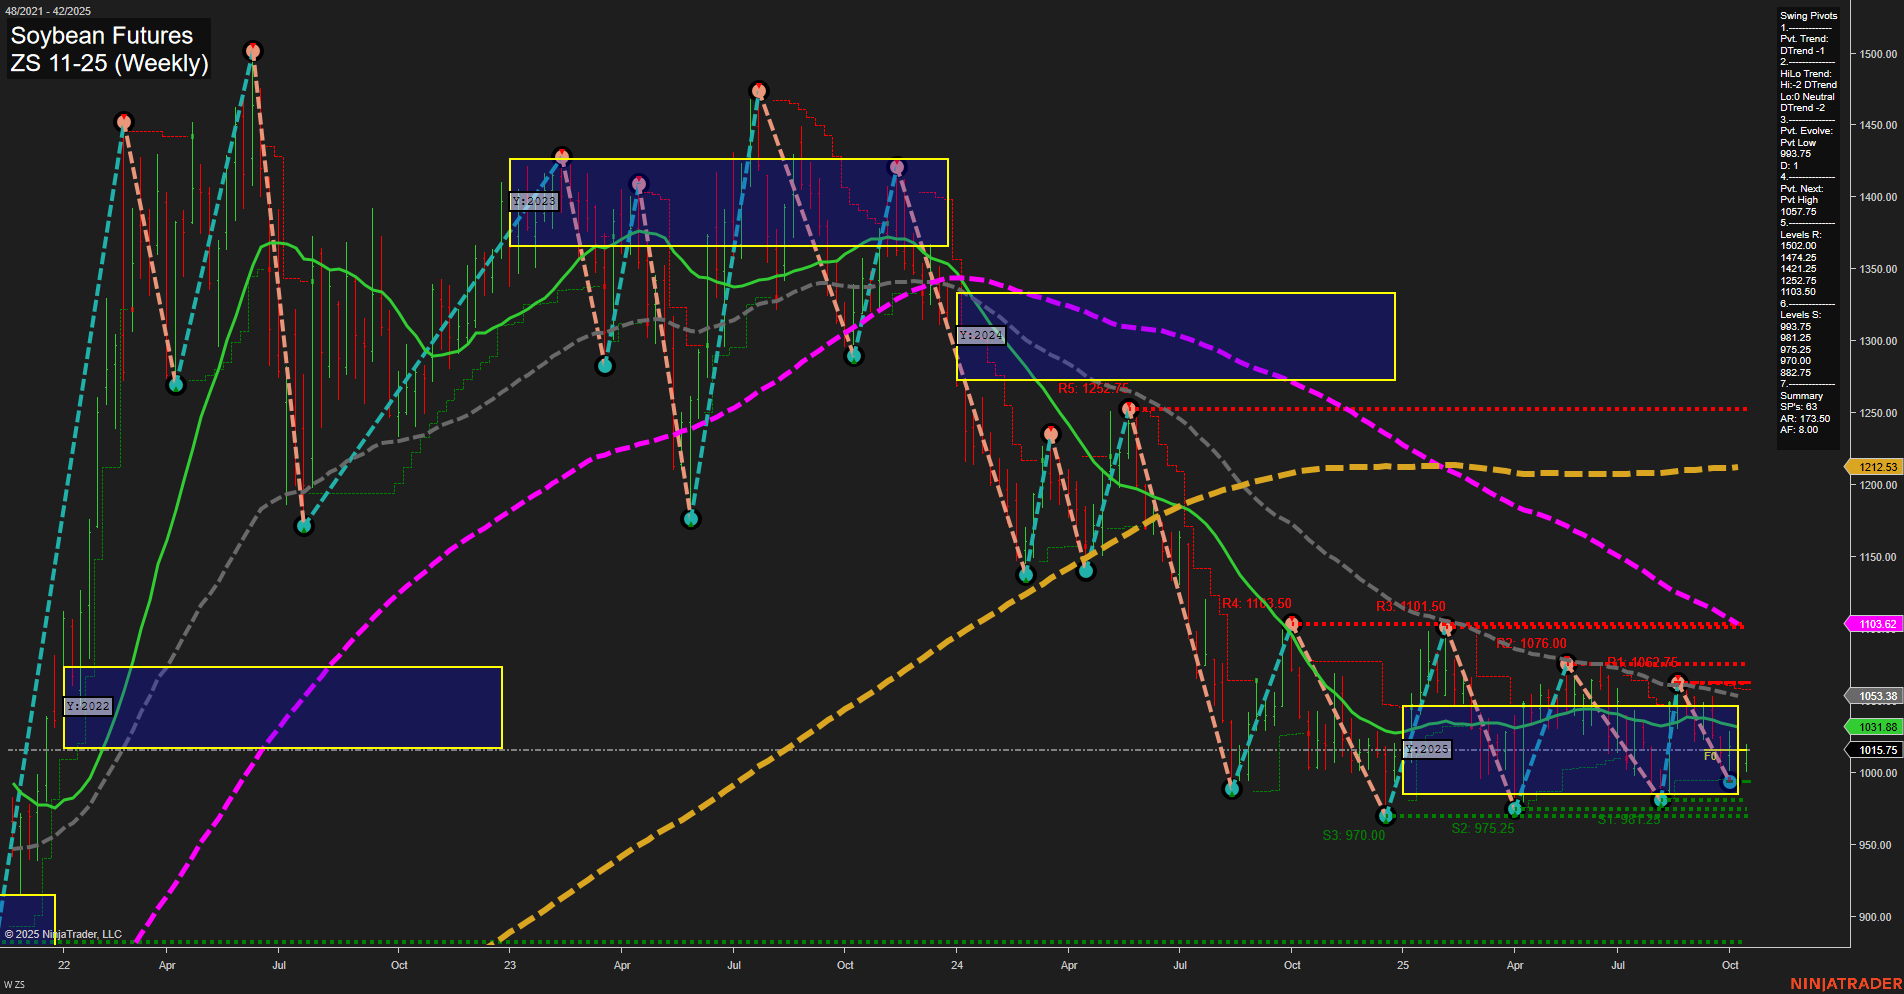
ZS Soybean Futures Weekly Chart Analysis: 2025-Oct-17 07:24 CT
Price Action
- Last: 1015.75,
- Bars: Medium,
- Mom: Momentum slow.
WSFG Weekly
- Short-Term
- WSFG Current: 35%
- F0%/NTZ' Bias: Price Above,
- WSFG Trend: Up.
MSFG Month Oct
- Intermediate-Term
- MSFG Current: 31%
- F0%/NTZ' Bias: Price Above,
- MSFG Trend: Up.
YSFG Year 2025
- Long-Term
- YSFG Current: 0%
- F0%/NTZ' Bias: Price Neutral,
- YSFG Trend: Neutral.
Swing Pivots
- (Short-Term) 1. Pvt. Trend: DTrend,
- (Intermediate-Term) 2. HiLo Trend: LoD Neutral,
- 3. Pvt. Evolve: Pvt low 963.75,
- 4. Pvt. Next: Pvt high 1075.75,
- 5. Levels R: 1252.5, 1207.75, 1142.25, 1111.5, 1076, 1062.75, 1011.5,
- 6. Levels S: 963.75, 975.25, 970, 870, 822.75.
Weekly Benchmarks
- (Intermediate-Term) 5 Week: 1031.88 Down Trend,
- (Intermediate-Term) 10 Week: 1053.38 Down Trend,
- (Long-Term) 20 Week: 1103.62 Down Trend,
- (Long-Term) 55 Week: 1212.53 Down Trend,
- (Long-Term) 100 Week: 1103.62 Down Trend,
- (Long-Term) 200 Week: 1212.53 Down Trend.
Recent Trade Signals
- 17 Oct 2025: Long ZS 11-25 @ 1012 Signals.USAR-WSFG
- 16 Oct 2025: Long ZS 11-25 @ 1013 Signals.USAR.TR120
Overall Rating
- Short-Term: Neutral,
- Intermediate-Term: Neutral,
- Long-Term: Bearish.
Key Insights Summary
Soybean futures are currently trading in a consolidation phase, with price action contained within a well-defined range and momentum remaining slow. The short-term and intermediate-term Fib grid trends are showing an upward bias, but this is countered by a dominant downtrend in all major moving averages, indicating persistent long-term bearish pressure. Swing pivot analysis highlights a recent pivot low at 963.75 and a potential move toward the next pivot high at 1075.75, but resistance levels remain stacked above current prices, suggesting overhead supply. Support is clustered just below, reinforcing the range-bound nature of the market. Recent trade signals have triggered long entries, reflecting attempts to capture short-term upside within the broader consolidation. Overall, the market is in a holding pattern, with neither bulls nor bears in clear control, and price is oscillating between key support and resistance levels as participants await a decisive breakout or breakdown.
Chart Analysis ATS AI Generated: 2025-10-17 07:24 for Informational use only, not trading advice. Terms and Risk Disclosure Copyright © 2025. Algo Trading Systems LLC.
