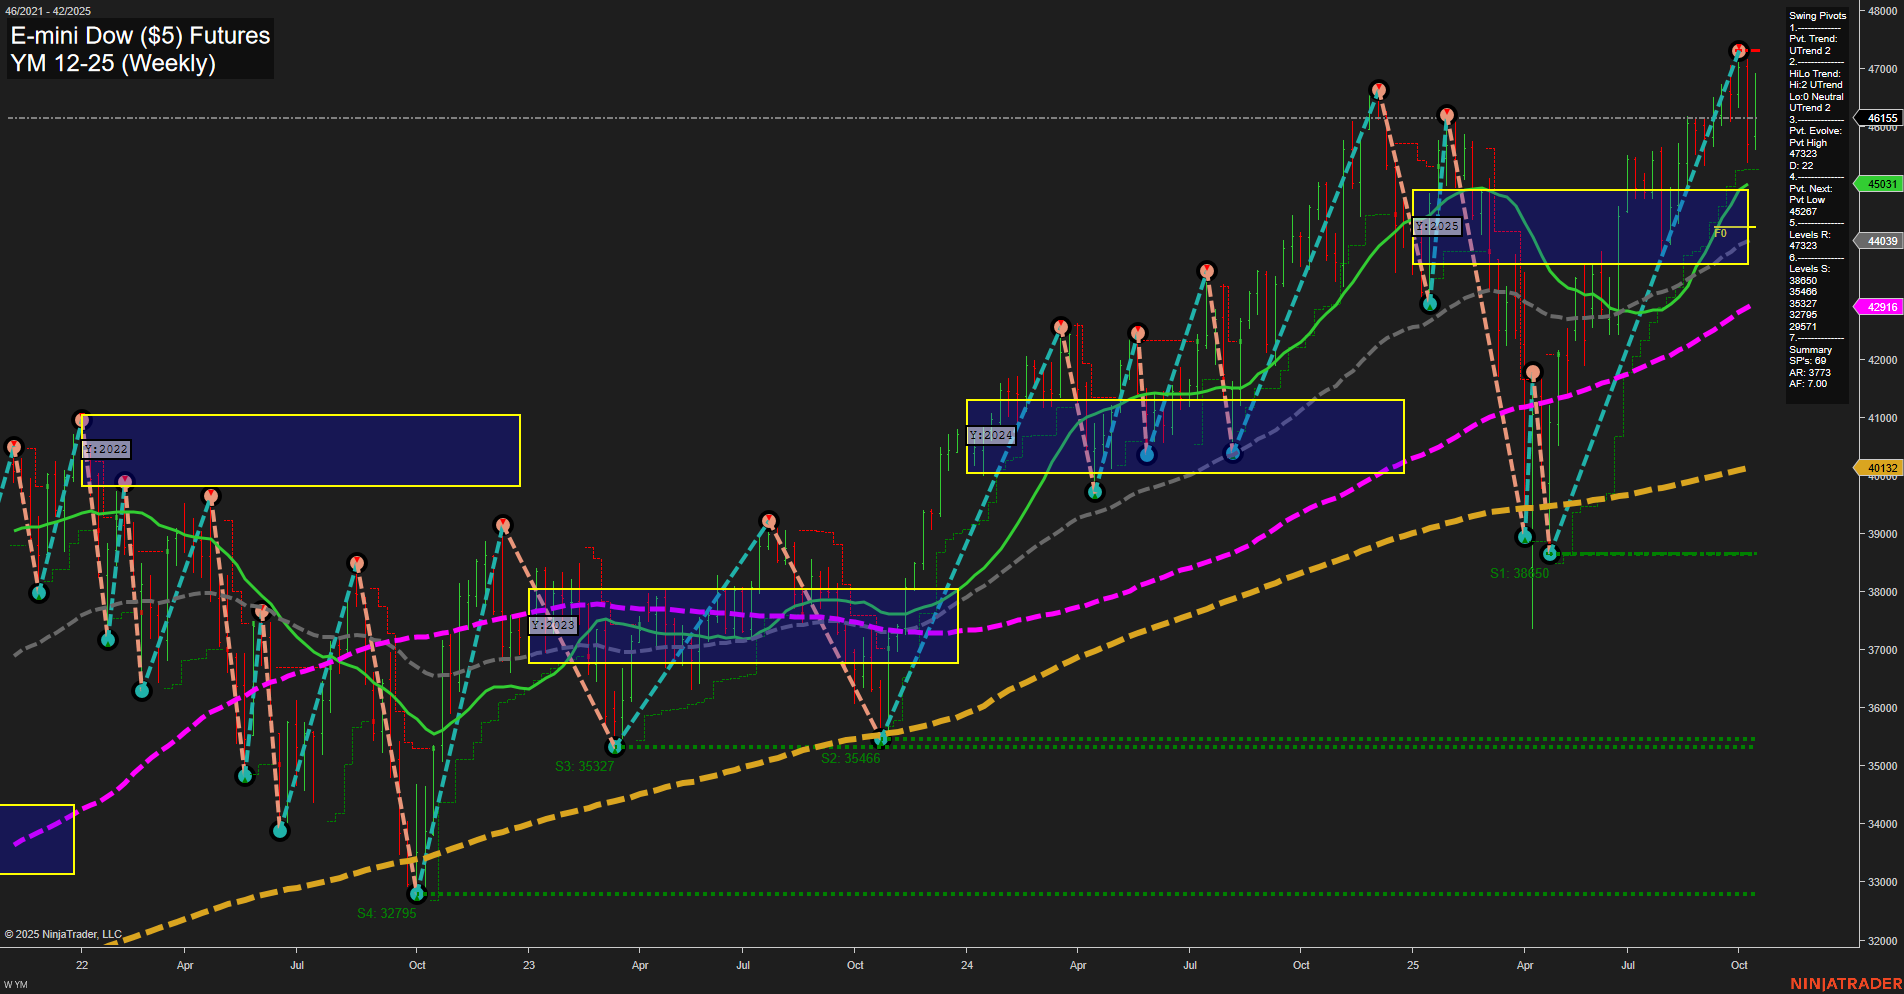
YM E-mini Dow ($5) Futures Weekly Chart Analysis: 2025-Oct-17 07:21 CT
Price Action
- Last: 45,714,
- Bars: Large,
- Mom: Momentum fast.
WSFG Weekly
- Short-Term
- WSFG Current: 27%
- F0%/NTZ' Bias: Price Above,
- WSFG Trend: Up.
MSFG Month Oct
- Intermediate-Term
- MSFG Current: -18%
- F0%/NTZ' Bias: Price Below,
- MSFG Trend: Down.
YSFG Year 2025
- Long-Term
- YSFG Current: 29%
- F0%/NTZ' Bias: Price Above,
- YSFG Trend: Up.
Swing Pivots
- (Short-Term) 1. Pvt. Trend: UTrend,
- (Intermediate-Term) 2. HiLo Trend: DTrend,
- 3. Pvt. Evolve: Pvt high 46,155,
- 4. Pvt. Next: Pvt low 45,031,
- 5. Levels R: 47,223, 46,155,
- 6. Levels S: 39,377, 38,450, 35,327, 32,795.
Weekly Benchmarks
- (Intermediate-Term) 5 Week: 45,031 Up Trend,
- (Intermediate-Term) 10 Week: 44,039 Up Trend,
- (Long-Term) 20 Week: 45,031 Up Trend,
- (Long-Term) 55 Week: 42,916 Up Trend,
- (Long-Term) 100 Week: 42,377 Up Trend,
- (Long-Term) 200 Week: 40,132 Up Trend.
Recent Trade Signals
- 17 Oct 2025: Short YM 12-25 @ 45714 Signals.USAR-WSFG
- 16 Oct 2025: Short YM 12-25 @ 46126 Signals.USAR.TR120
- 16 Oct 2025: Short YM 12-25 @ 46165 Signals.USAR-MSFG
- 10 Oct 2025: Short YM 12-25 @ 46092 Signals.USAR.TR720
Overall Rating
- Short-Term: Neutral,
- Intermediate-Term: Bearish,
- Long-Term: Bullish.
Key Insights Summary
The YM E-mini Dow futures weekly chart shows a market in transition. Price action is characterized by large bars and fast momentum, indicating heightened volatility and strong directional moves. The short-term WSFG trend is up, with price holding above the NTZ center, but recent trade signals have triggered short entries, suggesting a potential short-term pause or pullback. Intermediate-term MSFG trend is down, with price below the monthly NTZ, reflecting a corrective phase or retracement within the broader uptrend. Long-term YSFG and all major moving averages remain in strong uptrends, confirming the underlying bullish structure. Swing pivots highlight a recent pivot high at 46,155 and next support at 45,031, with significant support levels much lower, indicating room for deeper pullbacks if selling persists. The overall structure suggests a market that remains bullish on a long-term basis, but is currently experiencing intermediate-term weakness and short-term indecision, likely driven by profit-taking, macroeconomic news, or seasonal volatility. The market is at a key inflection point, with the potential for either a resumption of the uptrend or a deeper correction depending on how price reacts to current support and resistance levels.
Chart Analysis ATS AI Generated: 2025-10-17 07:22 for Informational use only, not trading advice. Terms and Risk Disclosure Copyright © 2025. Algo Trading Systems LLC.
