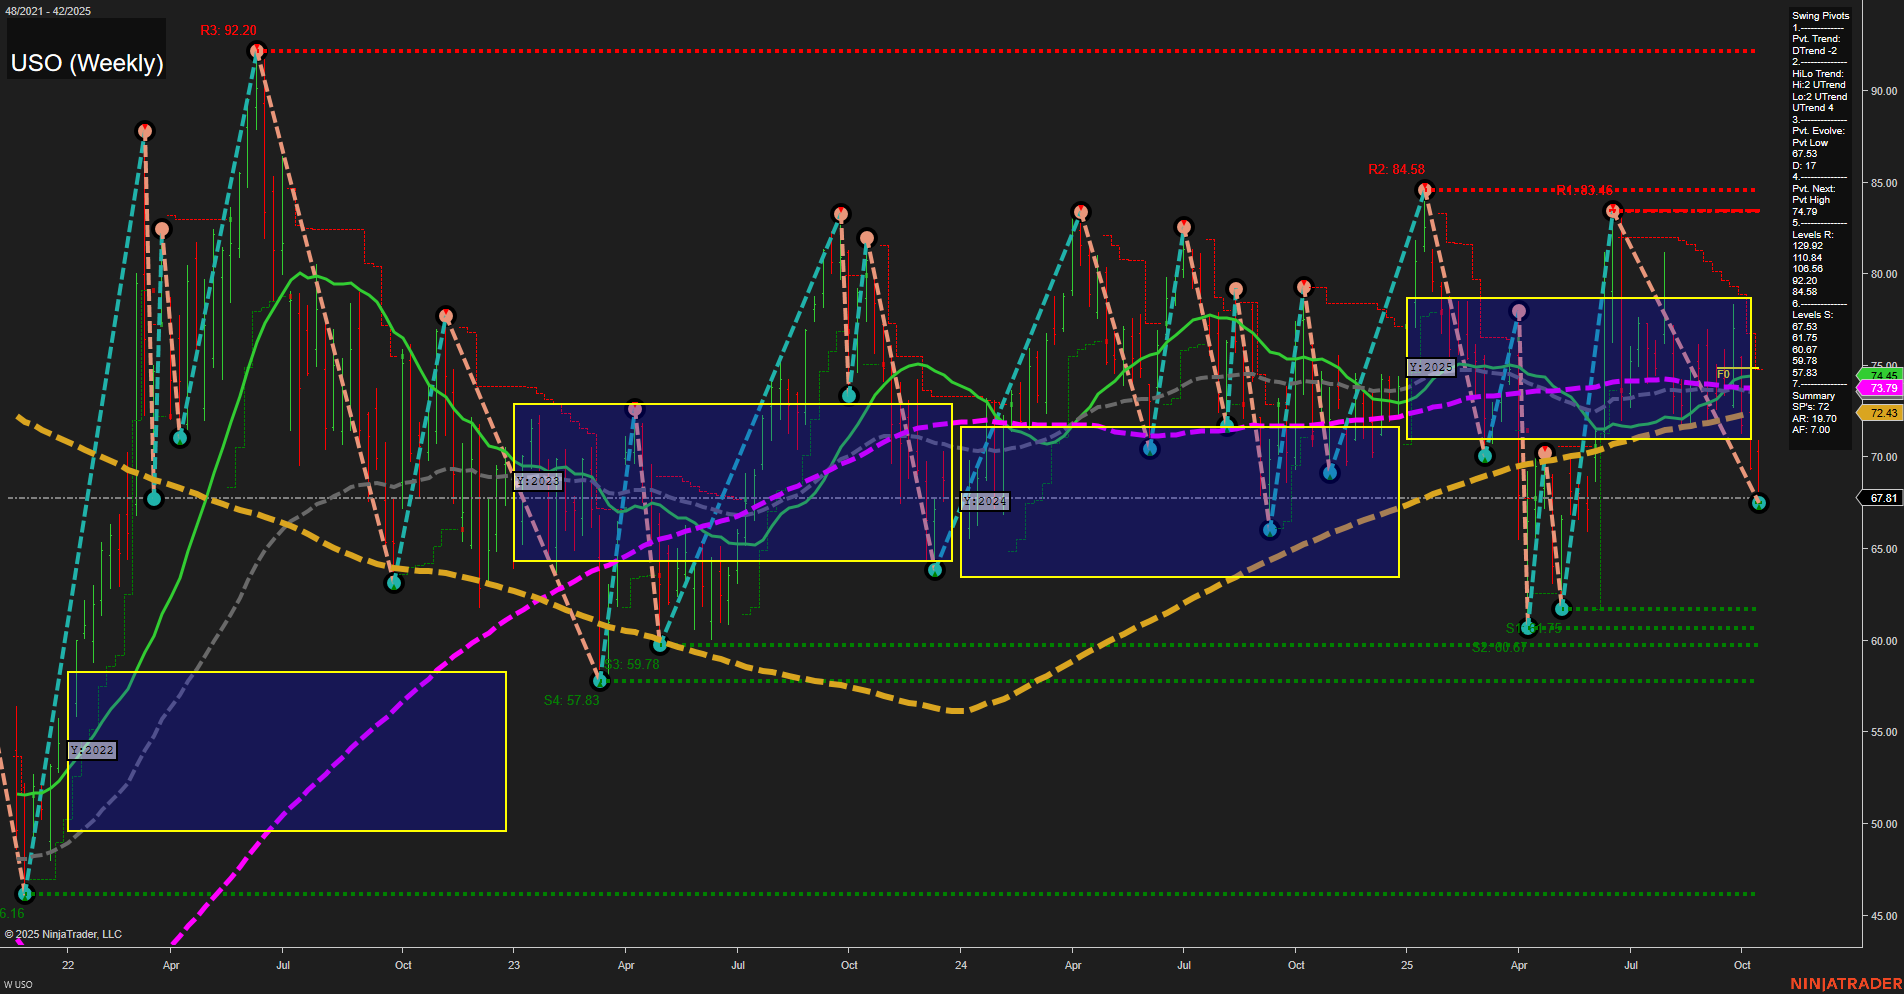
USO United States Oil Fund LP Weekly Chart Analysis: 2025-Oct-17 07:20 CT
Price Action
- Last: 67.81,
- Bars: Medium,
- Mom: Momentum slow.
WSFG Weekly
- Short-Term
- WSFG Current: NA%
- F0%/NTZ' Bias: Price Neutral,
- WSFG Trend: Neutral.
MSFG Month Oct
- Intermediate-Term
- MSFG Current: NA%
- F0%/NTZ' Bias: Price Neutral,
- MSFG Trend: Neutral.
YSFG Year 2025
- Long-Term
- YSFG Current: NA%
- F0%/NTZ' Bias: Price Neutral,
- YSFG Trend: Neutral.
Swing Pivots
- (Short-Term) 1. Pvt. Trend: DTrend,
- (Intermediate-Term) 2. HiLo Trend: UTrend,
- 3. Pvt. Evolve: Pvt low 67.49,
- 4. Pvt. Next: Pvt high 74.79,
- 5. Levels R: 92.20, 84.58, 83.45, 74.79,
- 6. Levels S: 67.49, 60.67, 59.78, 57.83, 56.16.
Weekly Benchmarks
- (Intermediate-Term) 5 Week: 73.74 Down Trend,
- (Intermediate-Term) 10 Week: 73.79 Down Trend,
- (Long-Term) 20 Week: 72.43 Down Trend,
- (Long-Term) 55 Week: 74.46 Down Trend,
- (Long-Term) 100 Week: 73.79 Down Trend,
- (Long-Term) 200 Week: 72.43 Down Trend.
Overall Rating
- Short-Term: Bearish,
- Intermediate-Term: Neutral,
- Long-Term: Bearish.
Key Insights Summary
USO is currently exhibiting a slow momentum decline, with the last price at 67.81, sitting near recent swing lows. The short-term swing pivot trend is down, while the intermediate-term HiLo trend remains up, suggesting a possible divergence and a market in transition. All major weekly moving averages (5, 10, 20, 55, 100, 200) are trending down, reinforcing a bearish long-term structure. Price is consolidating within the yearly NTZ, with no clear directional bias from the session fib grids, indicating a neutral stance from a volatility and range perspective. Resistance levels are stacked well above current price, while support is clustered just below, highlighting a potential for further downside tests or a base-building phase. The overall environment is characterized by choppy, range-bound action with a bearish tilt, as the market digests prior declines and seeks direction. Futures swing traders should note the lack of strong momentum and the presence of both support and resistance clusters, which may lead to continued consolidation or a volatility expansion if key levels are breached.
Chart Analysis ATS AI Generated: 2025-10-17 07:21 for Informational use only, not trading advice. Terms and Risk Disclosure Copyright © 2025. Algo Trading Systems LLC.
