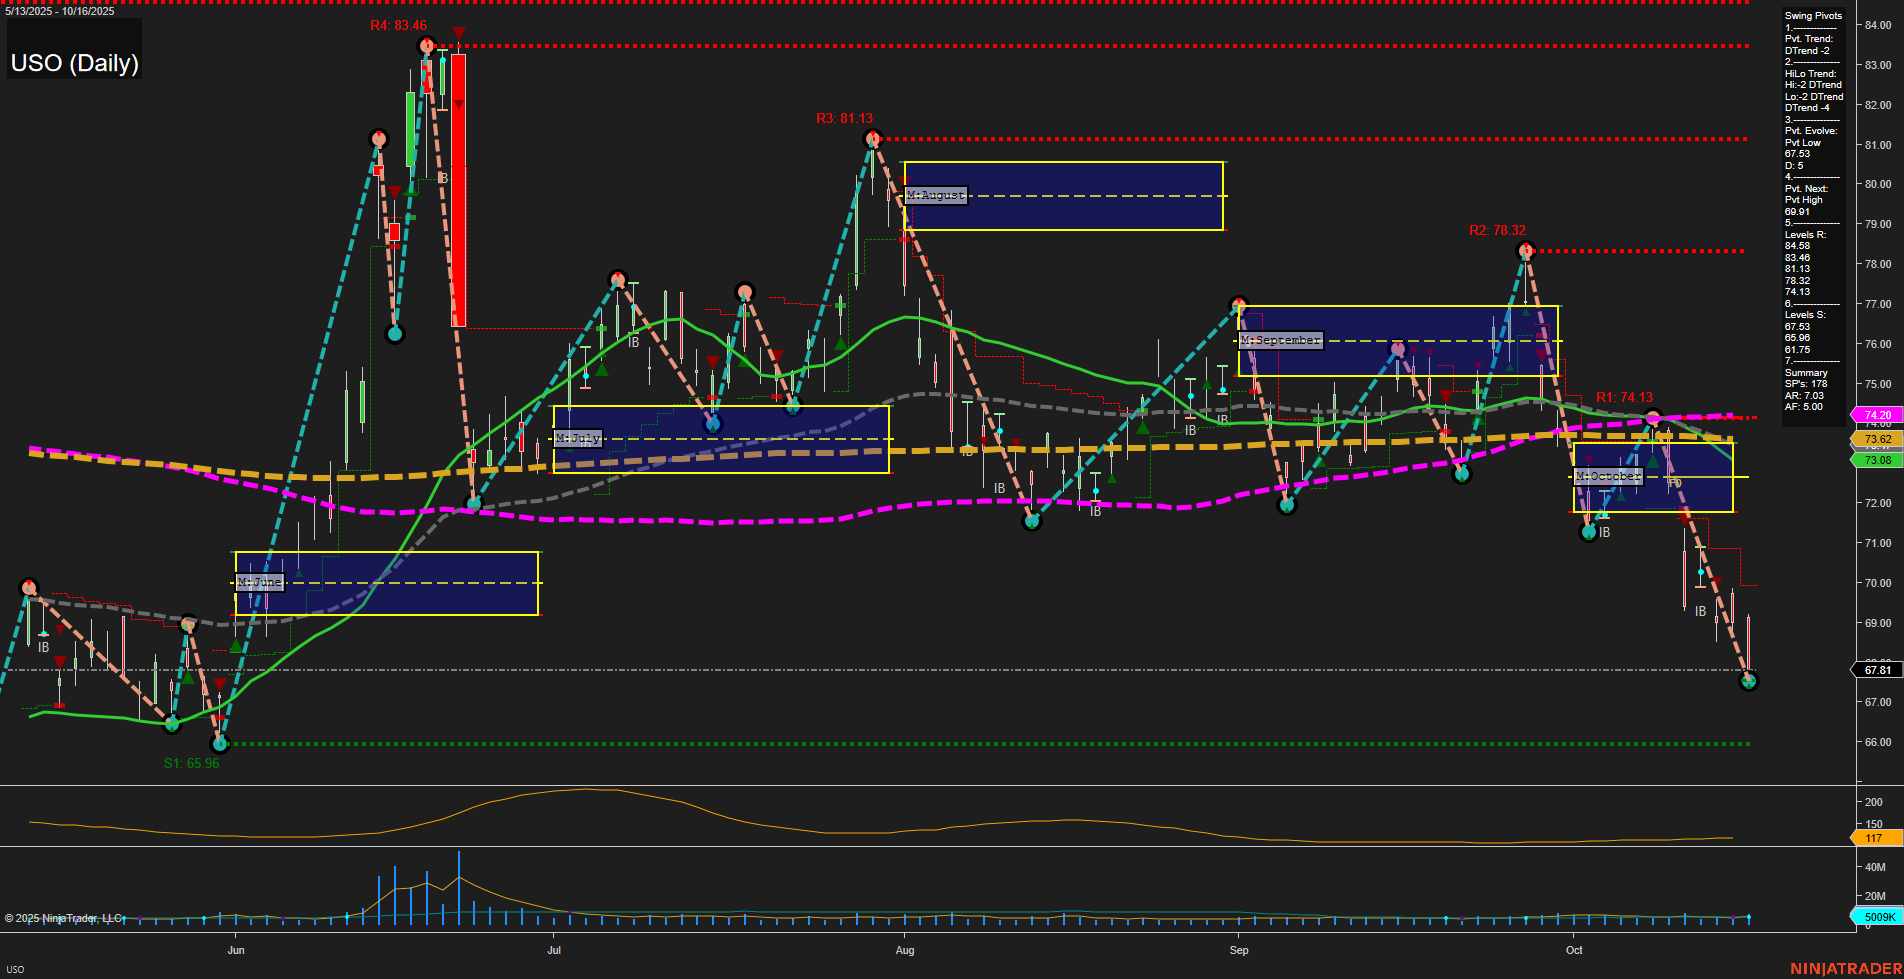
USO United States Oil Fund LP Daily Chart Analysis: 2025-Oct-17 07:20 CT
Price Action
- Last: 67.81,
- Bars: Large,
- Mom: Momentum fast.
WSFG Weekly
- Short-Term
- WSFG Current: NA%
- F0%/NTZ' Bias: Price Neutral,
- WSFG Trend: Neutral.
MSFG Month Oct
- Intermediate-Term
- MSFG Current: NA%
- F0%/NTZ' Bias: Price Neutral,
- MSFG Trend: Neutral.
YSFG Year 2025
- Long-Term
- YSFG Current: NA%
- F0%/NTZ' Bias: Price Neutral,
- YSFG Trend: Neutral.
Swing Pivots
- (Short-Term) 1. Pvt. Trend: DTrend,
- (Intermediate-Term) 2. HiLo Trend: DTrend,
- 3. Pvt. Evolve: Pvt low 67.15,
- 4. Pvt. Next: Pvt high 69.91,
- 5. Levels R: 83.46, 81.13, 78.32, 74.13, 71.75,
- 6. Levels S: 65.96.
Daily Benchmarks
- (Short-Term) 5 Day: 69.03 Down Trend,
- (Short-Term) 10 Day: 71.77 Down Trend,
- (Intermediate-Term) 20 Day: 73.08 Down Trend,
- (Intermediate-Term) 55 Day: 73.62 Down Trend,
- (Long-Term) 100 Day: 74.20 Down Trend,
- (Long-Term) 200 Day: 74.13 Down Trend.
Additional Metrics
Overall Rating
- Short-Term: Bearish,
- Intermediate-Term: Bearish,
- Long-Term: Bearish.
Key Insights Summary
USO is exhibiting pronounced downside momentum, with large daily bars and fast momentum confirming strong selling pressure. All benchmark moving averages across short, intermediate, and long-term horizons are trending down, reinforcing a persistent bearish environment. The swing pivot structure is in a clear downtrend both short and intermediate term, with the most recent pivot low at 67.15 and the next potential reversal only at 69.91, indicating that the path of least resistance remains to the downside. Resistance levels are stacked well above current price, while the nearest support is at 65.96, suggesting limited immediate downside targets but little sign of reversal. The ATR remains elevated, reflecting heightened volatility, while volume is robust, supporting the conviction behind the move. The overall technical landscape points to a strong, trending sell-off phase, with no current evidence of stabilization or reversal, and price action is well below all major moving averages. This environment is typical of a momentum-driven breakdown, often seen after failed support retests and breakdowns from consolidation zones.
Chart Analysis ATS AI Generated: 2025-10-17 07:20 for Informational use only, not trading advice. Terms and Risk Disclosure Copyright © 2025. Algo Trading Systems LLC.
