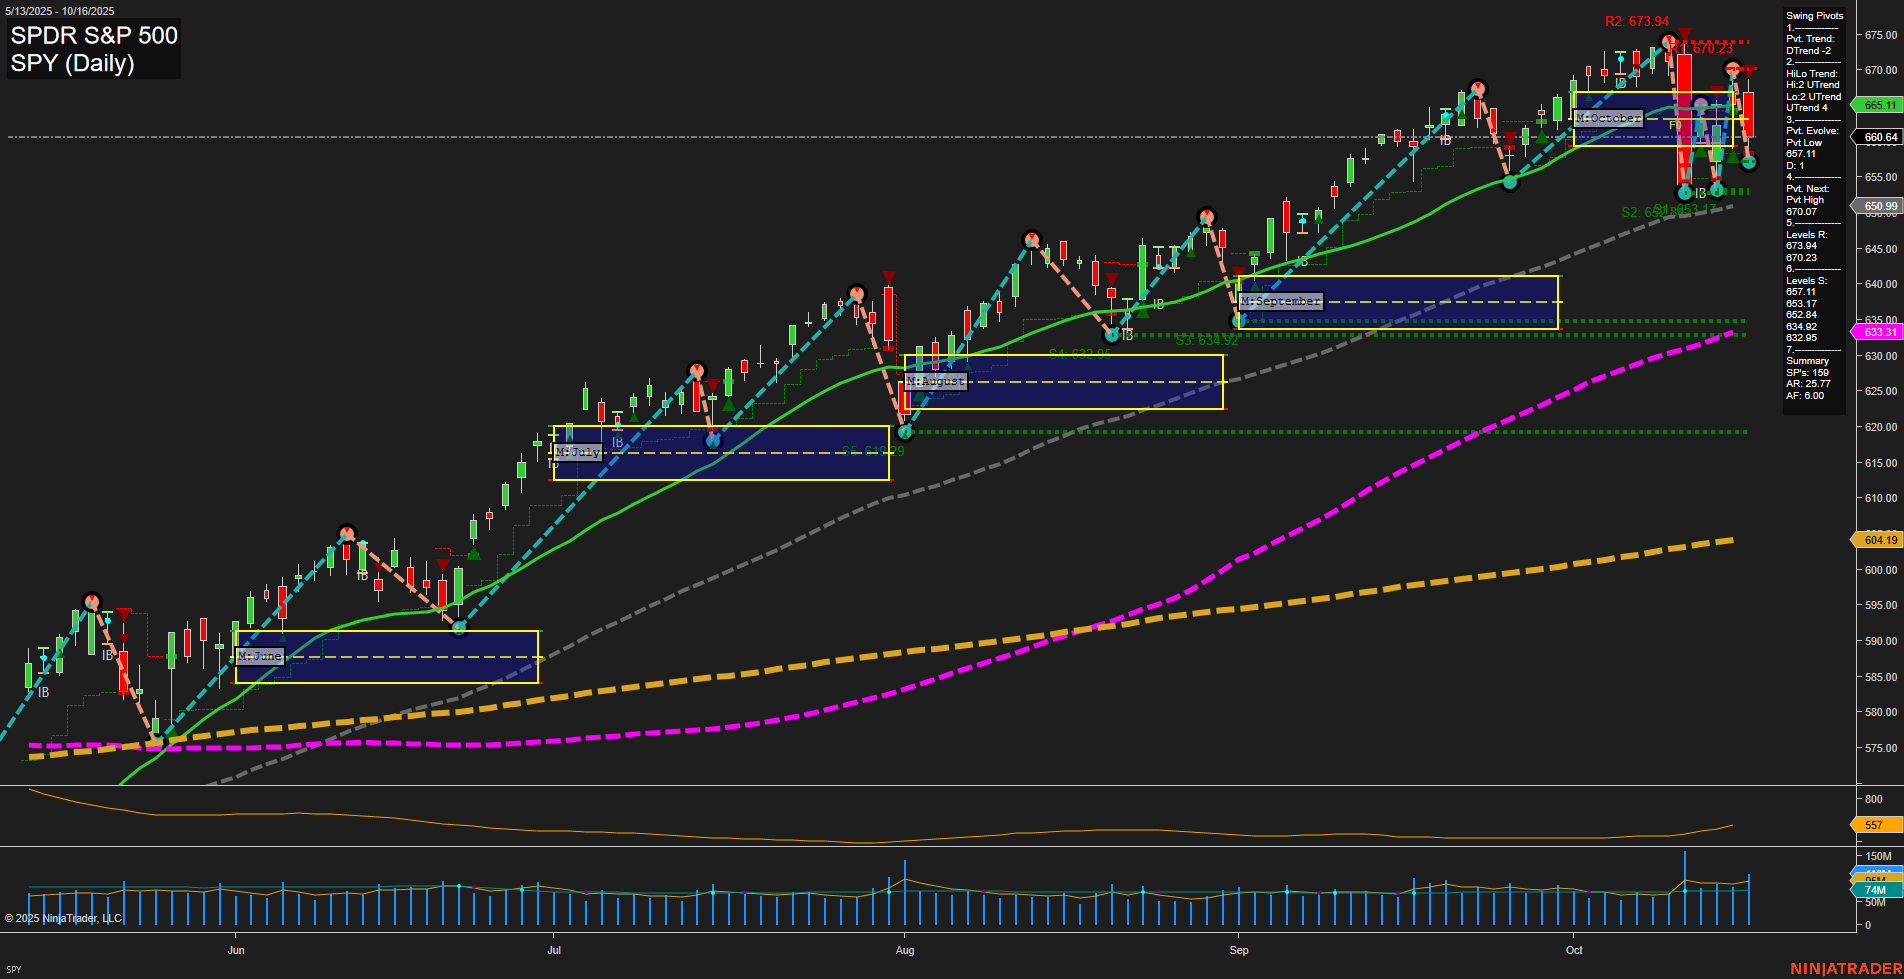
SPY SPDR S&P 500 Daily Chart Analysis: 2025-Oct-17 07:18 CT
Price Action
- Last: 665.11,
- Bars: Large,
- Mom: Momentum fast.
WSFG Weekly
- Short-Term
- WSFG Current: NA%
- F0%/NTZ' Bias: Price Neutral,
- WSFG Trend: Neutral.
MSFG Month Oct
- Intermediate-Term
- MSFG Current: NA%
- F0%/NTZ' Bias: Price Neutral,
- MSFG Trend: Neutral.
YSFG Year 2025
- Long-Term
- YSFG Current: NA%
- F0%/NTZ' Bias: Price Neutral,
- YSFG Trend: Neutral.
Swing Pivots
- (Short-Term) 1. Pvt. Trend: DTrend,
- (Intermediate-Term) 2. HiLo Trend: UTrend,
- 3. Pvt. Evolve: Pvt high 670.07,
- 4. Pvt. Next: Pvt low 653.17,
- 5. Levels R: 673.94, 670.23,
- 6. Levels S: 653.17, 650.99, 633.31, 632.85.
Daily Benchmarks
- (Short-Term) 5 Day: 665.99 Down Trend,
- (Short-Term) 10 Day: 667.43 Down Trend,
- (Intermediate-Term) 20 Day: 659.52 Down Trend,
- (Intermediate-Term) 55 Day: 633.31 Up Trend,
- (Long-Term) 100 Day: 647.17 Up Trend,
- (Long-Term) 200 Day: 604.19 Up Trend.
Additional Metrics
Overall Rating
- Short-Term: Bearish,
- Intermediate-Term: Neutral,
- Long-Term: Bullish.
Key Insights Summary
The SPY daily chart shows a recent shift in short-term momentum, with large bars and fast price action indicating heightened volatility. The short-term swing pivot trend has turned down (DTrend), and both the 5-day and 10-day moving averages are in a downtrend, confirming short-term bearishness. However, the intermediate-term HiLo trend remains up, and the 55-day, 100-day, and 200-day moving averages are all trending higher, supporting a bullish long-term structure. Key resistance is clustered near recent highs (673.94, 670.23), while support is layered below (653.17, 650.99, 633.31, 632.85). The ATR is elevated, reflecting increased volatility, and volume remains robust. Overall, the market is experiencing a short-term pullback or correction within a broader uptrend, with the potential for further downside in the near term before longer-term bullish momentum may reassert itself. The current environment is characterized by choppy, volatile price action, with the potential for both sharp retracements and quick reversals.
Chart Analysis ATS AI Generated: 2025-10-17 07:19 for Informational use only, not trading advice. Terms and Risk Disclosure Copyright © 2025. Algo Trading Systems LLC.
