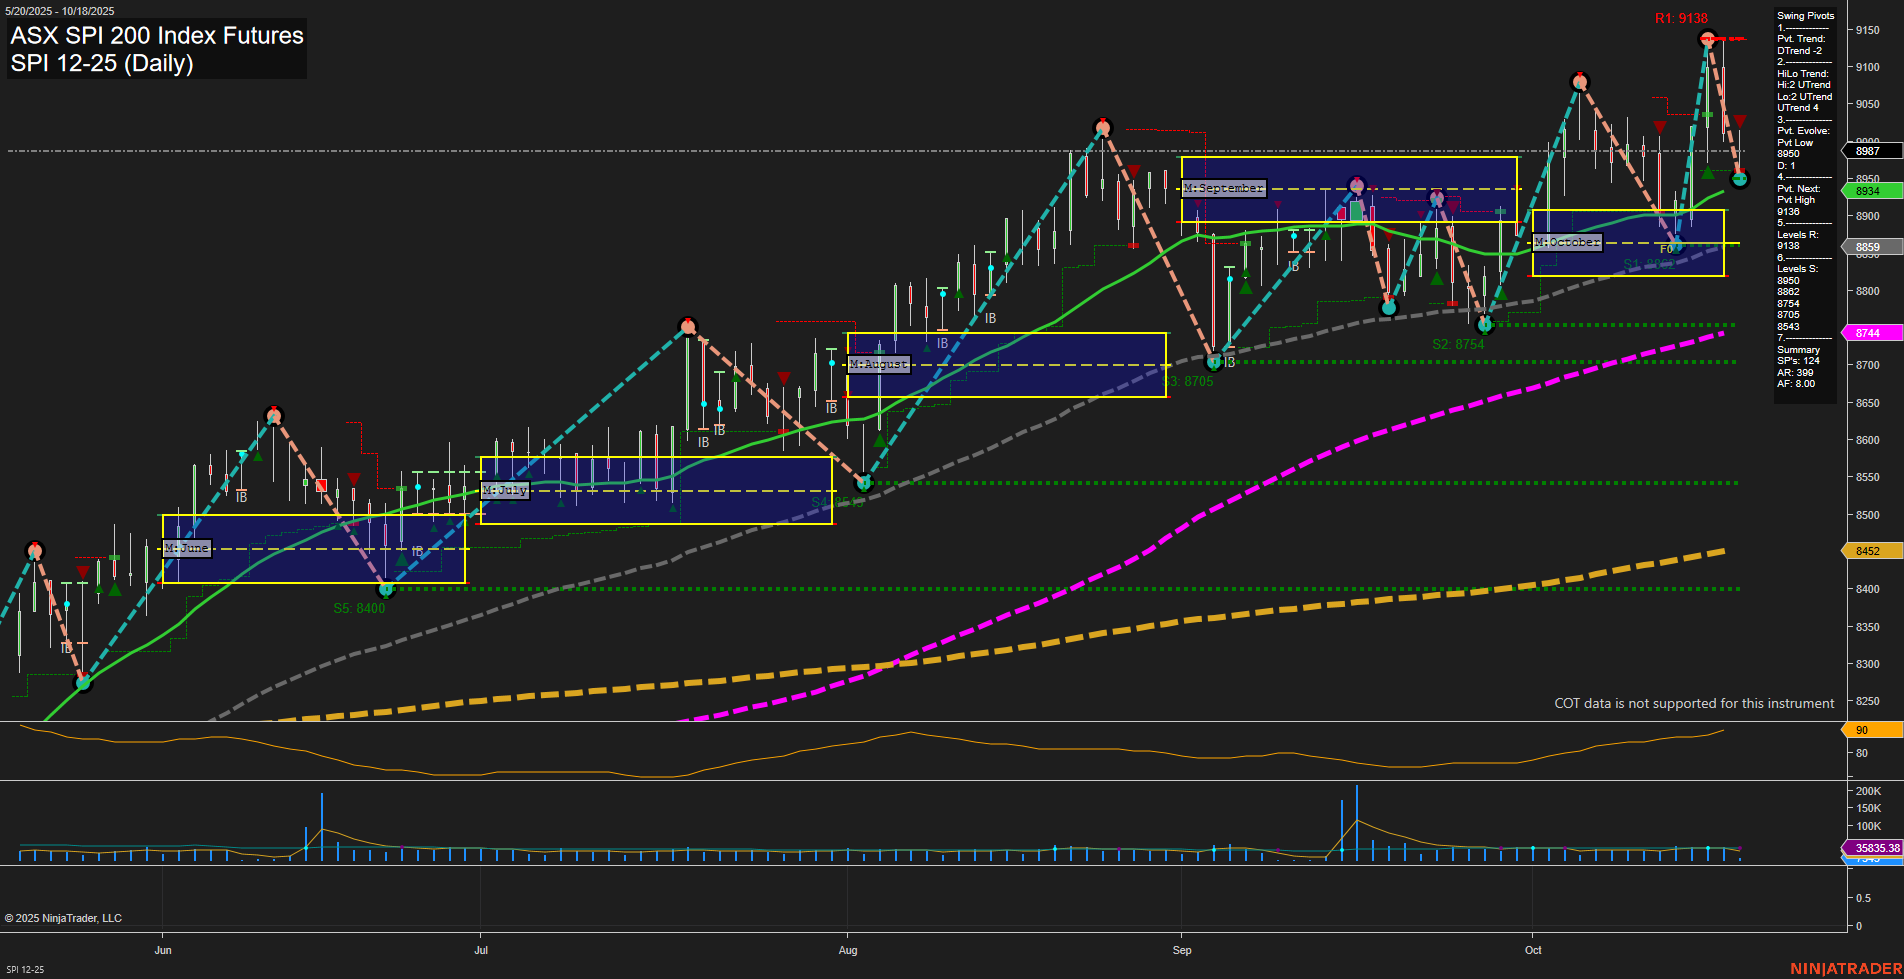
SPI ASX SPI 200 Index Futures Daily Chart Analysis: 2025-Oct-17 07:18 CT
Price Action
- Last: 8934,
- Bars: Medium,
- Mom: Momentum average.
WSFG Weekly
- Short-Term
- WSFG Current: NA%
- F0%/NTZ' Bias: Price Neutral,
- WSFG Trend: Neutral.
MSFG Month Oct
- Intermediate-Term
- MSFG Current: NA%
- F0%/NTZ' Bias: Price Neutral,
- MSFG Trend: Neutral.
YSFG Year 2025
- Long-Term
- YSFG Current: NA%
- F0%/NTZ' Bias: Price Neutral,
- YSFG Trend: Neutral.
Swing Pivots
- (Short-Term) 1. Pvt. Trend: DTrend,
- (Intermediate-Term) 2. HiLo Trend: UTrend,
- 3. Pvt. Evolve: Pvt Low 8601,
- 4. Pvt. Next: Pvt High 9138,
- 5. Levels R: 9138, 9085, 8975, 8943,
- 6. Levels S: 8754, 8705, 8601, 8400.
Daily Benchmarks
- (Short-Term) 5 Day: 8997 Down Trend,
- (Short-Term) 10 Day: 9006 Down Trend,
- (Intermediate-Term) 20 Day: 8931 Down Trend,
- (Intermediate-Term) 55 Day: 8744 Up Trend,
- (Long-Term) 100 Day: 8452 Up Trend,
- (Long-Term) 200 Day: 8452 Up Trend.
Additional Metrics
Overall Rating
- Short-Term: Bearish,
- Intermediate-Term: Neutral,
- Long-Term: Bullish.
Key Insights Summary
The SPI 200 Index Futures daily chart currently reflects a mixed environment for swing traders. Short-term momentum has shifted to the downside, as indicated by the DTrend in the swing pivot and both the 5-day and 10-day moving averages trending lower. The price has recently pulled back from a swing high at 9138, with the next key resistance levels at 9138 and 9085, and support levels at 8754 and 8705. Intermediate-term structure remains neutral, with the 20-day moving average also turning down, but the 55-day and longer-term moving averages are still in uptrends, supporting a bullish long-term outlook. Volatility is moderate (ATR 96), and volume remains steady. The market appears to be in a corrective phase within a broader uptrend, with recent price action showing a retracement after a strong rally. This suggests a period of consolidation or potential for further pullback before any renewed upside momentum. No clear breakout or breakdown is evident, and the overall environment is characterized by a short-term bearish bias, neutral intermediate-term, and bullish long-term structure.
Chart Analysis ATS AI Generated: 2025-10-17 07:18 for Informational use only, not trading advice. Terms and Risk Disclosure Copyright © 2025. Algo Trading Systems LLC.
