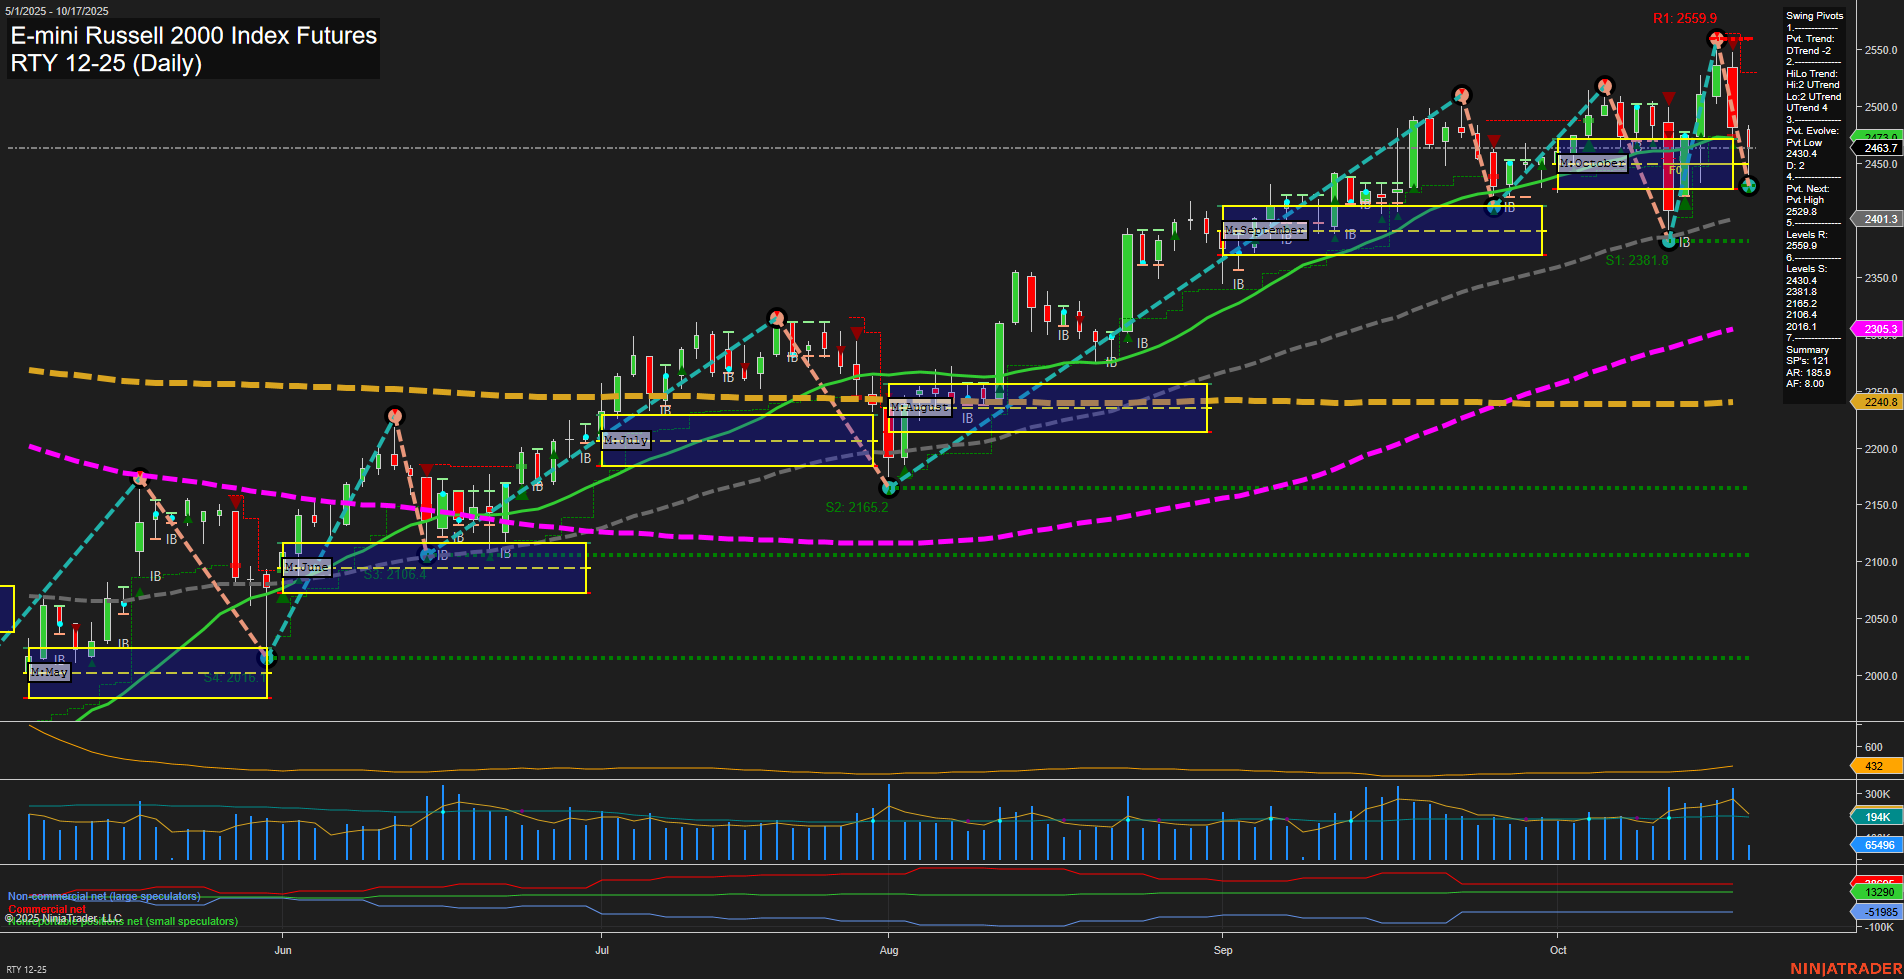
RTY E-mini Russell 2000 Index Futures Daily Chart Analysis: 2025-Oct-17 07:16 CT
Price Action
- Last: 2401.3,
- Bars: Large,
- Mom: Momentum fast.
WSFG Weekly
- Short-Term
- WSFG Current: 80%
- F0%/NTZ' Bias: Price Above,
- WSFG Trend: Up.
MSFG Month Oct
- Intermediate-Term
- MSFG Current: 18%
- F0%/NTZ' Bias: Price Above,
- MSFG Trend: Up.
YSFG Year 2025
- Long-Term
- YSFG Current: 28%
- F0%/NTZ' Bias: Price Above,
- YSFG Trend: Up.
Swing Pivots
- (Short-Term) 1. Pvt. Trend: DTrend,
- (Intermediate-Term) 2. HiLo Trend: UTrend,
- 3. Pvt. Evolve: Pvt low 2463.7,
- 4. Pvt. Next: Pvt high 2559.9,
- 5. Levels R: 2559.9, 2481.6, 2430.4, 2184.1, 2165.2, 2107.1,
- 6. Levels S: 2381.8, 2240.0.
Daily Benchmarks
- (Short-Term) 5 Day: 2430.4 Down Trend,
- (Short-Term) 10 Day: 2481.6 Down Trend,
- (Intermediate-Term) 20 Day: 2463.7 Down Trend,
- (Intermediate-Term) 55 Day: 2395.3 Up Trend,
- (Long-Term) 100 Day: 2305.9 Up Trend,
- (Long-Term) 200 Day: 2240.0 Up Trend.
Additional Metrics
Recent Trade Signals
- 16 Oct 2025: Short RTY 12-25 @ 2481.8 Signals.USAR.TR120
- 15 Oct 2025: Long RTY 12-25 @ 2530.2 Signals.USAR.TR720
- 14 Oct 2025: Long RTY 12-25 @ 2461.2 Signals.USAR-MSFG
- 10 Oct 2025: Short RTY 12-25 @ 2470.9 Signals.USAR-WSFG
Overall Rating
- Short-Term: Bearish,
- Intermediate-Term: Bullish,
- Long-Term: Bullish.
Key Insights Summary
The RTY daily chart shows a market in transition, with recent volatility and large price bars reflecting fast momentum. Short-term price action has shifted to a downtrend, as confirmed by the swing pivot trend and declining 5, 10, and 20-day moving averages. However, the intermediate and long-term trends remain bullish, supported by the upward trajectory of the 55, 100, and 200-day moving averages and the ongoing uptrend in the HiLo swing pivot metric. Price remains above key session fib grid levels (weekly, monthly, yearly), indicating underlying strength despite the recent pullback. The ATR is elevated, suggesting increased volatility, while volume remains robust. Recent trade signals highlight both long and short entries, reflecting the choppy, two-way action typical of a market in consolidation or transition. The current setup suggests a corrective phase within a broader uptrend, with the potential for further tests of support and resistance as the market digests recent gains and volatility persists.
Chart Analysis ATS AI Generated: 2025-10-17 07:16 for Informational use only, not trading advice. Terms and Risk Disclosure Copyright © 2025. Algo Trading Systems LLC.
