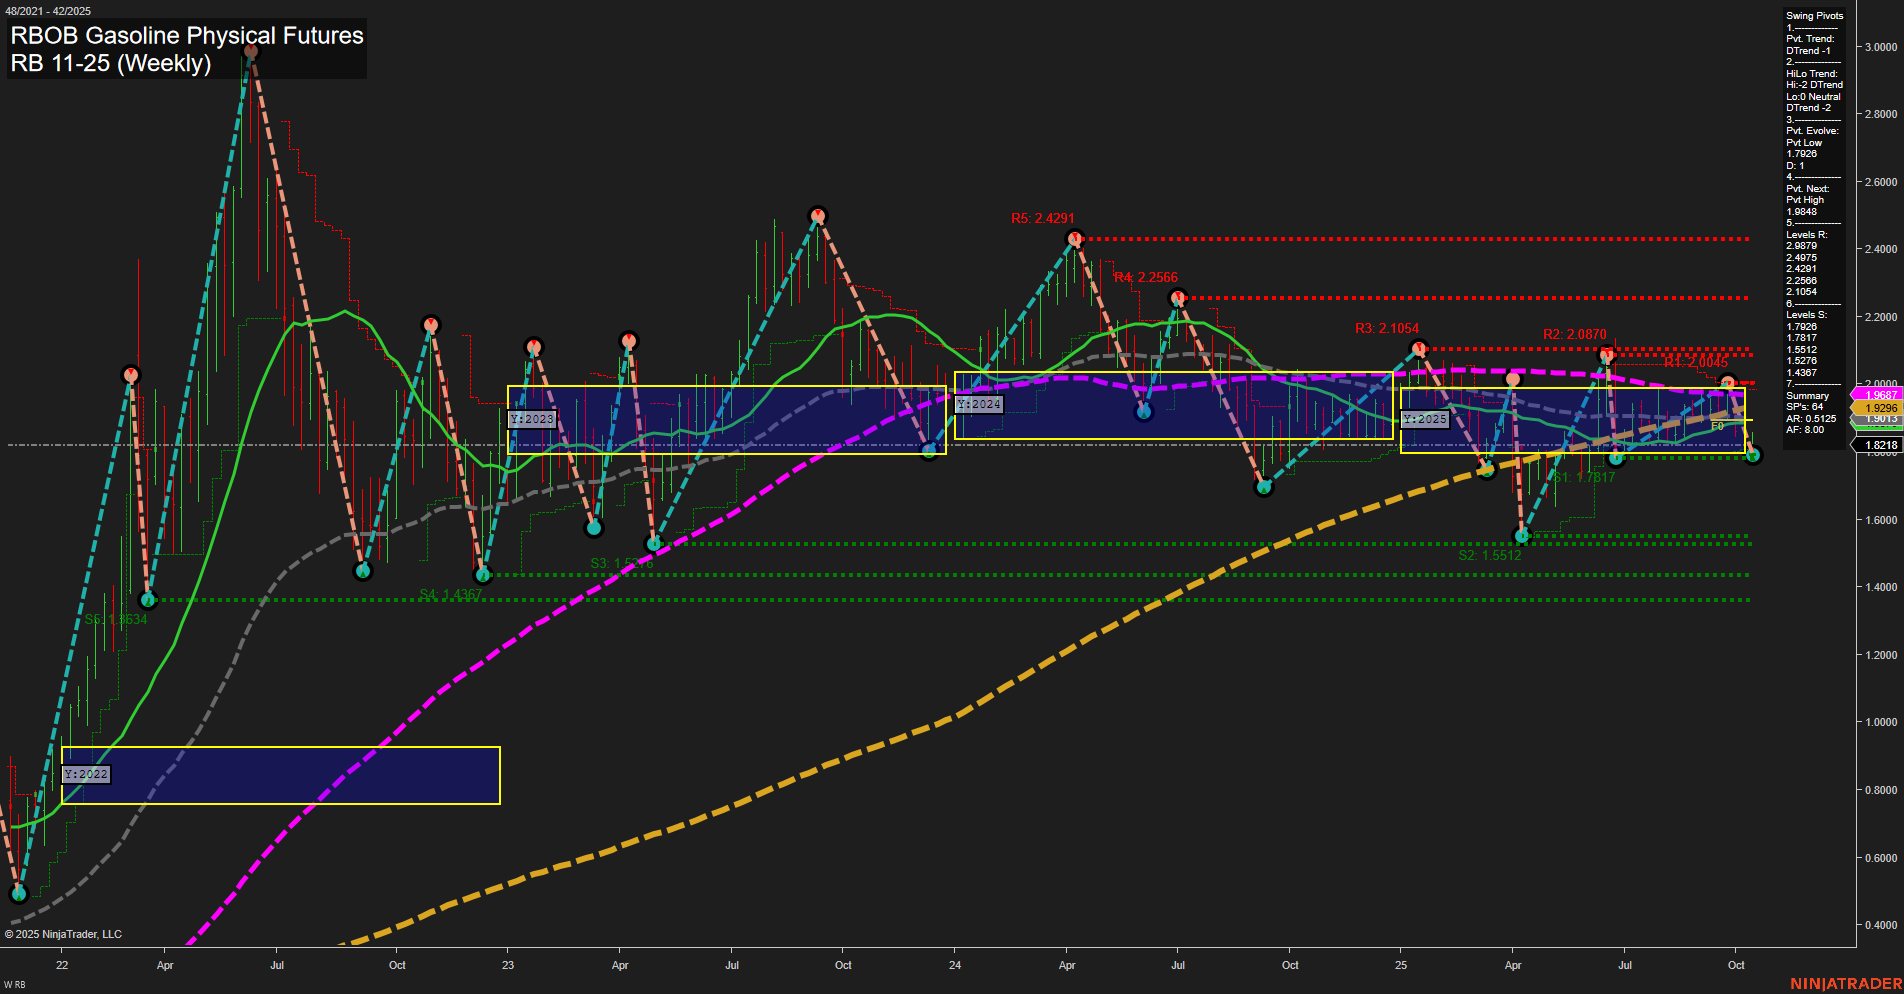
RB RBOB Gasoline Physical Futures Weekly Chart Analysis: 2025-Oct-17 07:15 CT
Price Action
- Last: 1.9926,
- Bars: Medium,
- Mom: Momentum slow.
WSFG Weekly
- Short-Term
- WSFG Current: 9%
- F0%/NTZ' Bias: Price Above,
- WSFG Trend: Up.
MSFG Month Oct
- Intermediate-Term
- MSFG Current: -49%
- F0%/NTZ' Bias: Price Below,
- MSFG Trend: Down.
YSFG Year 2025
- Long-Term
- YSFG Current: -7%
- F0%/NTZ' Bias: Price Below,
- YSFG Trend: Down.
Swing Pivots
- (Short-Term) 1. Pvt. Trend: DTrend,
- (Intermediate-Term) 2. HiLo Trend: DTrend,
- 3. Pvt. Evolve: Pvt low 1.7817,
- 4. Pvt. Next: Pvt high 1.9648,
- 5. Levels R: 2.4291, 2.2566, 2.1054, 2.0870, 1.9648,
- 6. Levels S: 1.7817, 1.5512, 1.4487, 1.3934.
Weekly Benchmarks
- (Intermediate-Term) 5 Week: 1.9926 Down Trend,
- (Intermediate-Term) 10 Week: 1.9911 Down Trend,
- (Long-Term) 20 Week: 1.9967 Down Trend,
- (Long-Term) 55 Week: 1.8195 Up Trend,
- (Long-Term) 100 Week: 1.9927 Down Trend,
- (Long-Term) 200 Week: 1.8195 Up Trend.
Recent Trade Signals
- 16 Oct 2025: Short RB 11-25 @ 1.8111 Signals.USAR.TR120
- 10 Oct 2025: Short RB 11-25 @ 1.8756 Signals.USAR-MSFG
Overall Rating
- Short-Term: Bearish,
- Intermediate-Term: Bearish,
- Long-Term: Bearish.
Key Insights Summary
The RBOB Gasoline futures market is currently exhibiting a bearish structure across all major timeframes. Price action is characterized by medium-sized bars and slow momentum, indicating a lack of strong directional conviction. The short-term WSFG trend is up, but this is countered by a prevailing downtrend in both the intermediate (MSFG) and long-term (YSFG) session fib grids, with price trading below key NTZ/F0% levels for both monthly and yearly grids. Swing pivot analysis confirms a dominant downtrend, with the most recent pivot low at 1.7817 and the next resistance at 1.9648. Multiple resistance levels overhead suggest significant supply, while support levels are clustered below, indicating potential for further downside if these are breached. Weekly benchmark moving averages are mostly in a downtrend, reinforcing the bearish outlook, despite the 55 and 200 week MAs still trending up, which may act as longer-term support. Recent trade signals have triggered short entries, aligning with the overall negative bias. The market appears to be in a corrective or consolidation phase within a broader downtrend, with lower highs and lower lows dominating the structure. Volatility remains moderate, and the market is likely to remain under pressure unless a significant reversal or breakout above resistance levels occurs.
Chart Analysis ATS AI Generated: 2025-10-17 07:16 for Informational use only, not trading advice. Terms and Risk Disclosure Copyright © 2025. Algo Trading Systems LLC.
