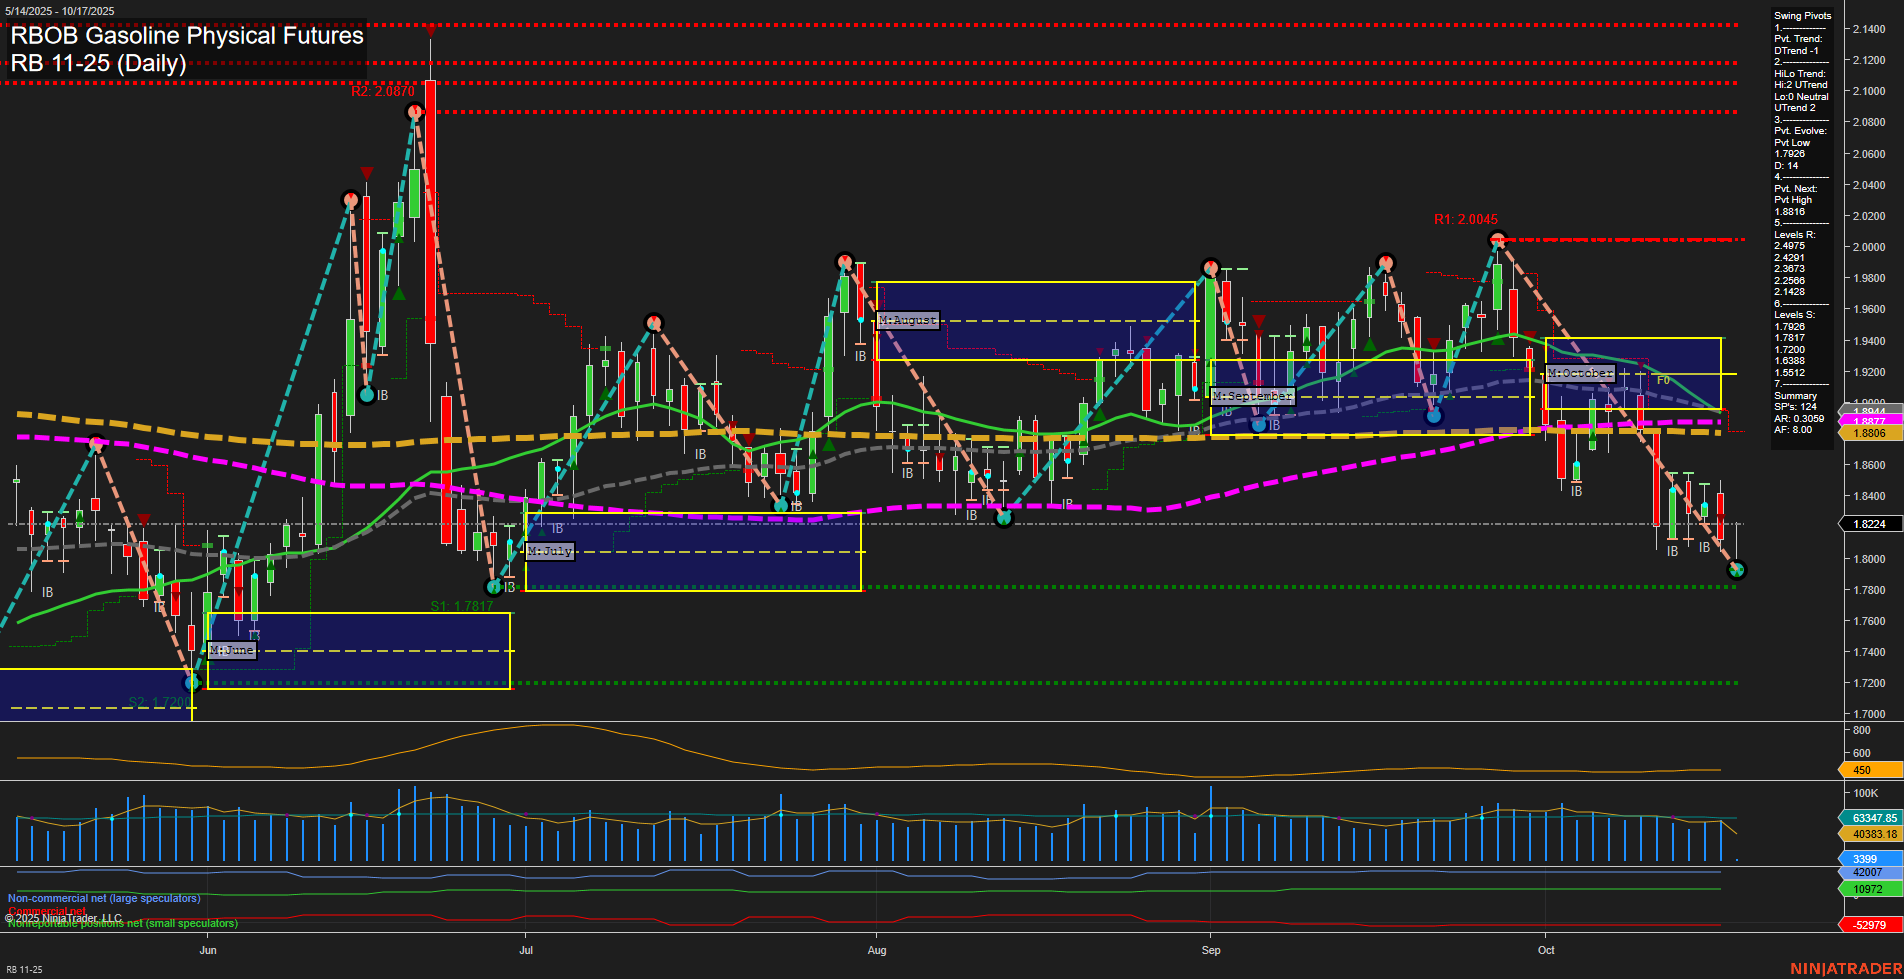
RB RBOB Gasoline Physical Futures Daily Chart Analysis: 2025-Oct-17 07:15 CT
Price Action
- Last: 1.8224,
- Bars: Medium,
- Mom: Momentum slow.
WSFG Weekly
- Short-Term
- WSFG Current: 9%
- F0%/NTZ' Bias: Price Above,
- WSFG Trend: Up.
MSFG Month Oct
- Intermediate-Term
- MSFG Current: -49%
- F0%/NTZ' Bias: Price Below,
- MSFG Trend: Down.
YSFG Year 2025
- Long-Term
- YSFG Current: -7%
- F0%/NTZ' Bias: Price Below,
- YSFG Trend: Down.
Swing Pivots
- (Short-Term) 1. Pvt. Trend: DTrend,
- (Intermediate-Term) 2. HiLo Trend: DTrend,
- 3. Pvt. Evolve: Pvt Low 1.814,
- 4. Pvt. Next: Pvt High 1.8896,
- 5. Levels R: 2.2687, 2.0045, 1.8896, 1.8826, 1.8512,
- 6. Levels S: 1.7781, 1.7207.
Daily Benchmarks
- (Short-Term) 5 Day: 1.8388 Down Trend,
- (Short-Term) 10 Day: 1.8512 Down Trend,
- (Intermediate-Term) 20 Day: 1.8826 Down Trend,
- (Intermediate-Term) 55 Day: 1.8896 Down Trend,
- (Long-Term) 100 Day: 1.9012 Down Trend,
- (Long-Term) 200 Day: 1.8886 Down Trend.
Additional Metrics
Recent Trade Signals
- 16 Oct 2025: Short RB 11-25 @ 1.8111 Signals.USAR.TR120
- 10 Oct 2025: Short RB 11-25 @ 1.8756 Signals.USAR-MSFG
Overall Rating
- Short-Term: Bearish,
- Intermediate-Term: Bearish,
- Long-Term: Bearish.
Key Insights Summary
RBOB Gasoline futures are exhibiting a clear bearish structure across all timeframes. Price action is characterized by medium-sized bars and slow momentum, with the last price at 1.8224, trading below most key moving averages and major swing resistance levels. The short-term WSFG trend is up, but this is overshadowed by the intermediate and long-term MSFG and YSFG trends, both of which are down, indicating sustained downward pressure. Swing pivot analysis confirms a dominant downtrend, with the most recent pivot low at 1.814 and the next potential reversal only at 1.8896, well above current levels. All benchmark moving averages (5, 10, 20, 55, 100, 200 day) are trending down, reinforcing the bearish outlook. Recent trade signals have also favored the short side, aligning with the prevailing trend. Volatility (ATR) and volume (VOLMA) are moderate, suggesting steady but not extreme trading conditions. Overall, the market is in a corrective or trending down phase, with no immediate signs of reversal, and any rallies are likely to encounter resistance at prior swing highs and moving averages.
Chart Analysis ATS AI Generated: 2025-10-17 07:15 for Informational use only, not trading advice. Terms and Risk Disclosure Copyright © 2025. Algo Trading Systems LLC.
