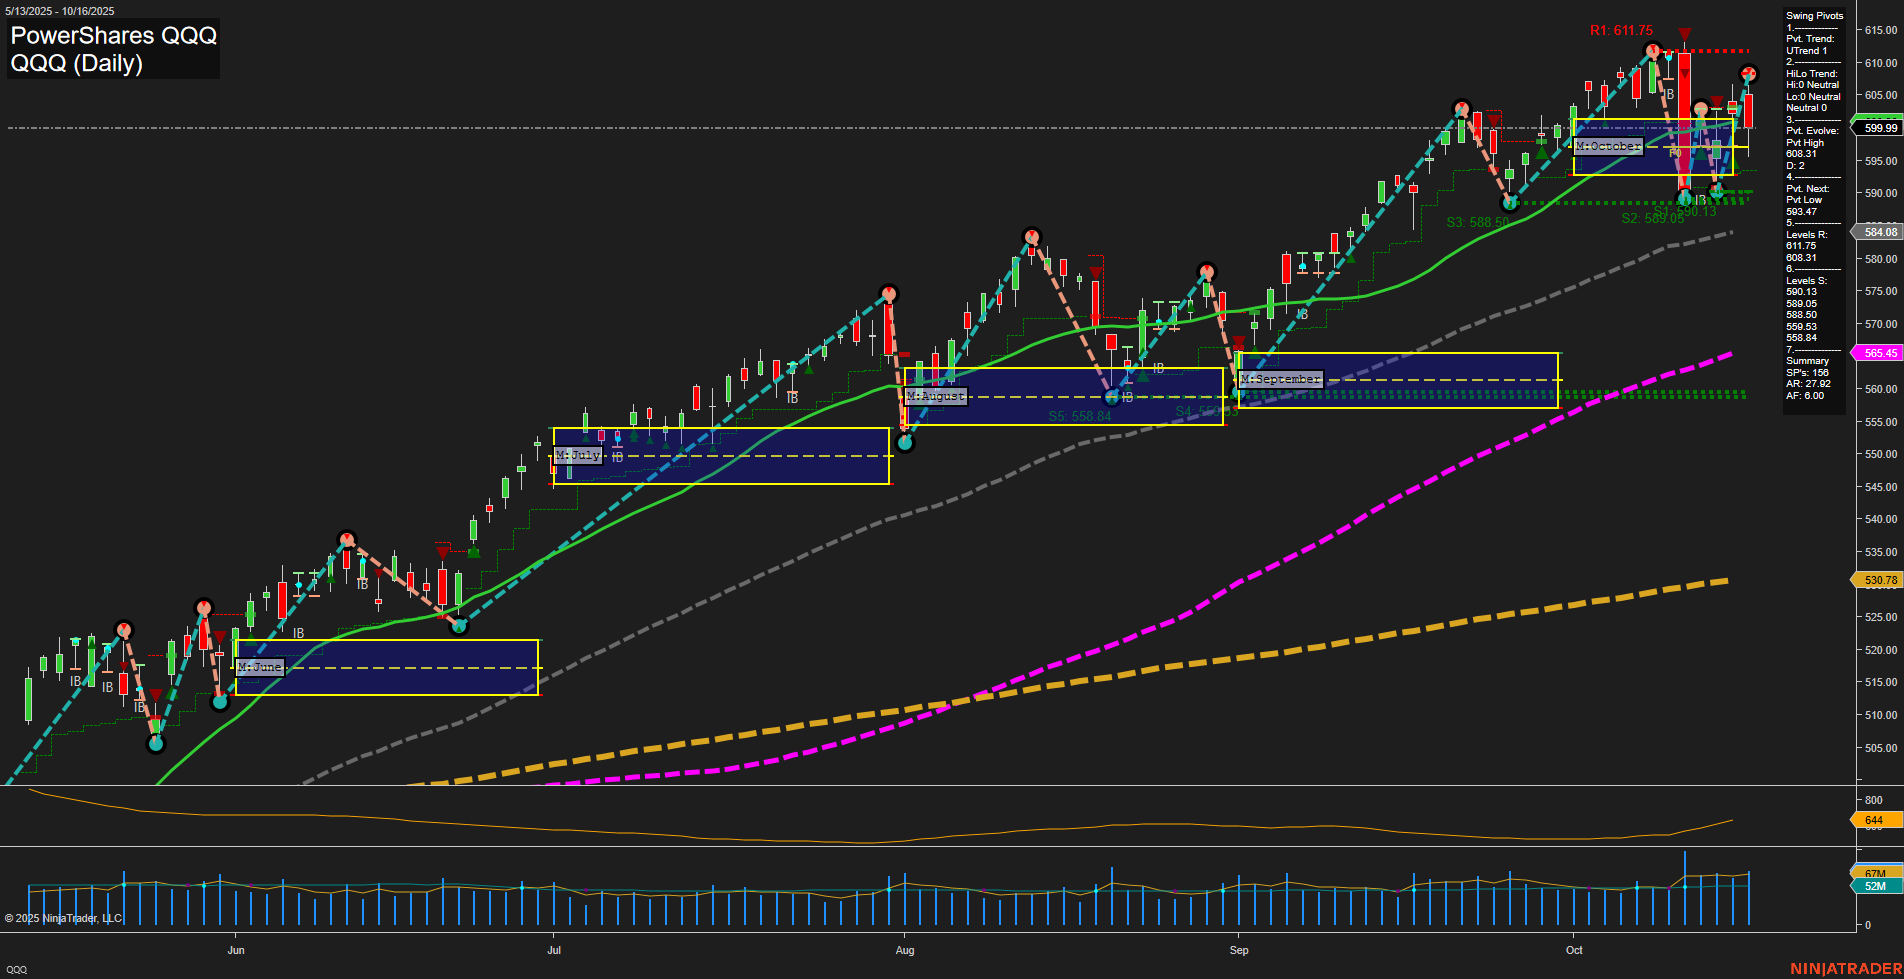
QQQ PowerShares QQQ Daily Chart Analysis: 2025-Oct-17 07:14 CT
Price Action
- Last: 599.99,
- Bars: Medium,
- Mom: Momentum average.
WSFG Weekly
- Short-Term
- WSFG Current: NA%
- F0%/NTZ' Bias: Price Neutral,
- WSFG Trend: Neutral.
MSFG Month Oct
- Intermediate-Term
- MSFG Current: NA%
- F0%/NTZ' Bias: Price Neutral,
- MSFG Trend: Neutral.
YSFG Year 2025
- Long-Term
- YSFG Current: NA%
- F0%/NTZ' Bias: Price Neutral,
- YSFG Trend: Neutral.
Swing Pivots
- (Short-Term) 1. Pvt. Trend: UTrend,
- (Intermediate-Term) 2. HiLo Trend: UTrend,
- 3. Pvt. Evolve: Pvt High 603.81,
- 4. Pvt. Next: Pvt Low 593.47,
- 5. Levels R: 611.75, 608.31, 603.81, 599.99, 588.05,
- 6. Levels S: 593.47, 588.84, 588.05.
Daily Benchmarks
- (Short-Term) 5 Day: 599.99 Up Trend,
- (Short-Term) 10 Day: 594.47 Up Trend,
- (Intermediate-Term) 20 Day: 588.50 Up Trend,
- (Intermediate-Term) 55 Day: 565.45 Up Trend,
- (Long-Term) 100 Day: 530.78 Up Trend,
- (Long-Term) 200 Day: 644.00 Down Trend.
Additional Metrics
- ATR: 733,
- VOLMA: 32,709,273.
Overall Rating
- Short-Term: Bullish,
- Intermediate-Term: Bullish,
- Long-Term: Neutral.
Key Insights Summary
The QQQ daily chart shows a strong bullish structure in both the short- and intermediate-term, with price action maintaining above all key moving averages except the 200-day, which remains in a downtrend. The most recent swing pivot is a high at 603.81, with the next potential pivot low at 593.47, indicating a possible area for a short-term pullback or consolidation. Resistance levels are stacked above, with 611.75 as the major swing high, while support is clustered around the 593–588 zone. Momentum is average and volatility (ATR) is elevated, suggesting active participation and potential for larger price swings. Volume remains robust, supporting the current trend. The overall environment is constructive for trend continuation, but the proximity to resistance and the neutral long-term trend (due to the 200-day MA) may lead to choppy or range-bound action if buyers cannot push through recent highs. No clear reversal signals are present, and the trend remains intact for now.
Chart Analysis ATS AI Generated: 2025-10-17 07:14 for Informational use only, not trading advice. Terms and Risk Disclosure Copyright © 2025. Algo Trading Systems LLC.
