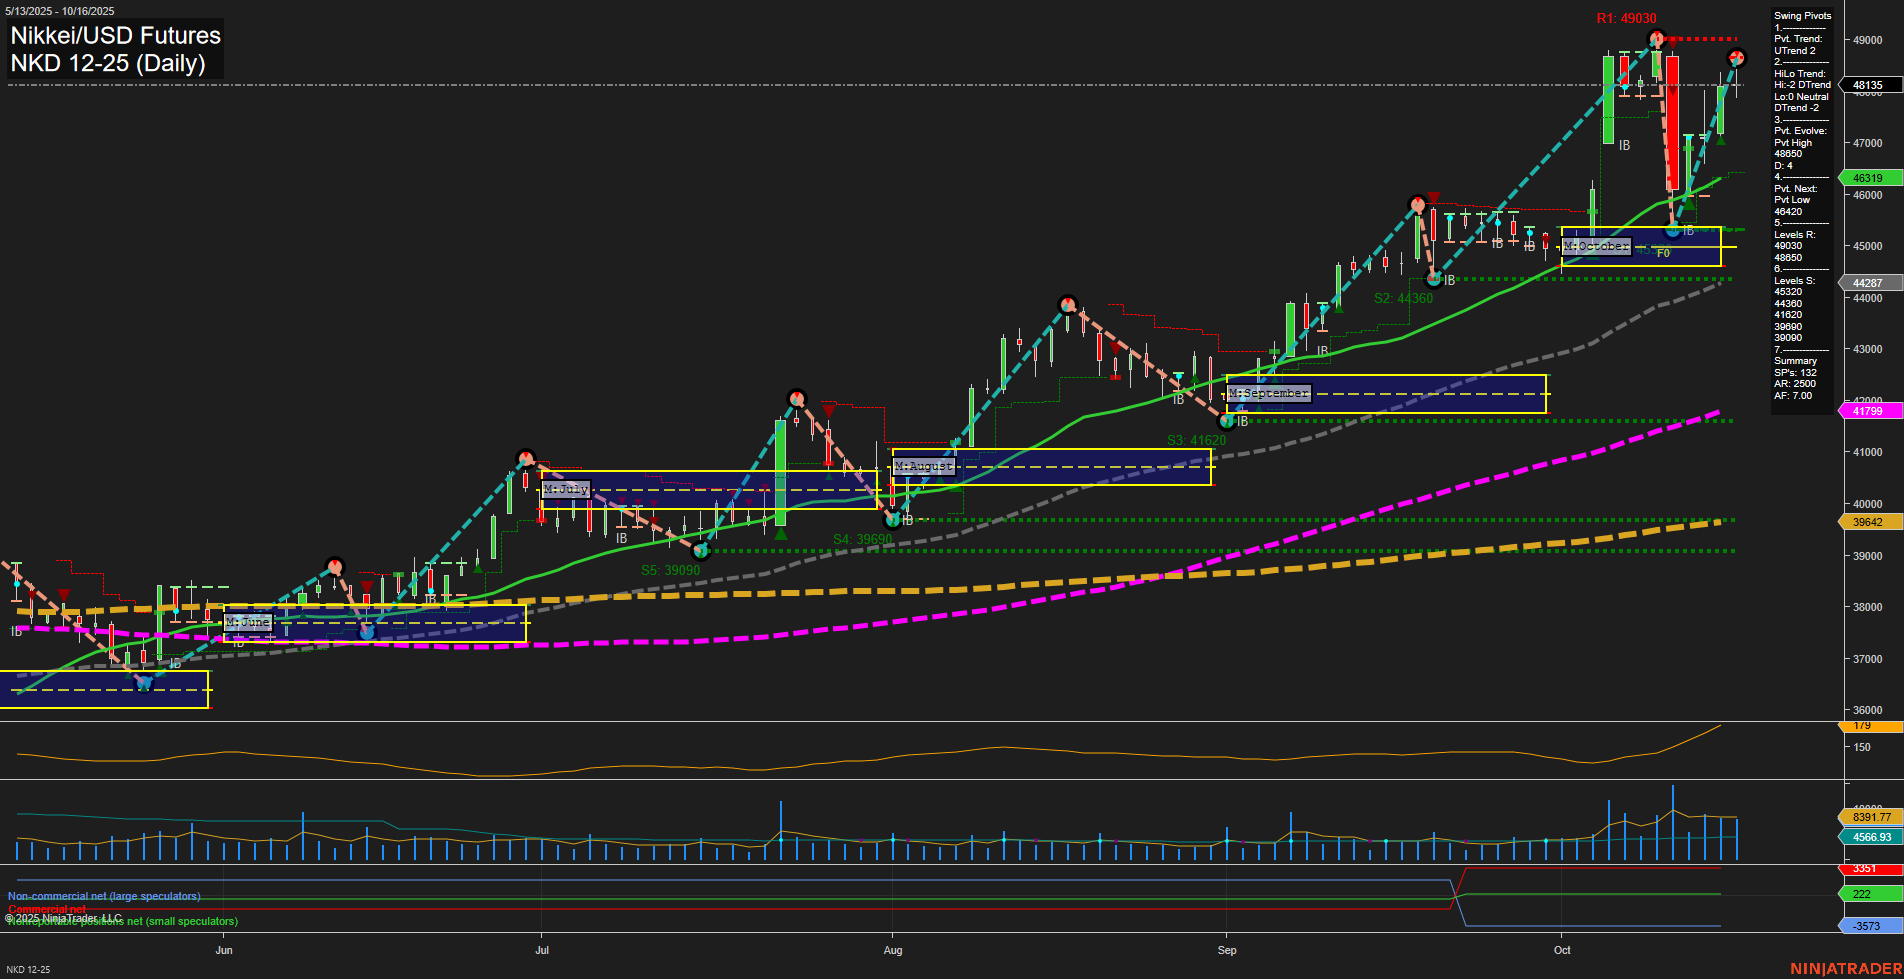
The NKD Nikkei/USD Futures daily chart shows a strong bullish structure in both the short- and long-term, with price action characterized by large, fast-momentum bars and the last price printing well above all key moving averages. The market is trading above the NTZ center lines for weekly, monthly, and yearly session fib grids, confirming a persistent uptrend across all timeframes. Swing pivots indicate a short-term uptrend, but the intermediate-term HiLo trend has shifted to down, suggesting some recent corrective action or consolidation after a strong rally. Resistance is defined at 49,030, with multiple support levels below, the nearest being 45,420. All benchmark moving averages are trending up, reinforcing the underlying bullish bias. Volatility remains elevated (ATR 140), and volume is robust (VOLMA 7,203), indicating active participation and potential for continued price swings. The most recent trade signal is a short entry, which may reflect a tactical countertrend move or profit-taking after a sharp advance. Overall, the market remains structurally bullish, but the presence of a short-term sell signal and a neutral intermediate-term rating suggest the potential for a pullback or sideways consolidation before the next directional move.