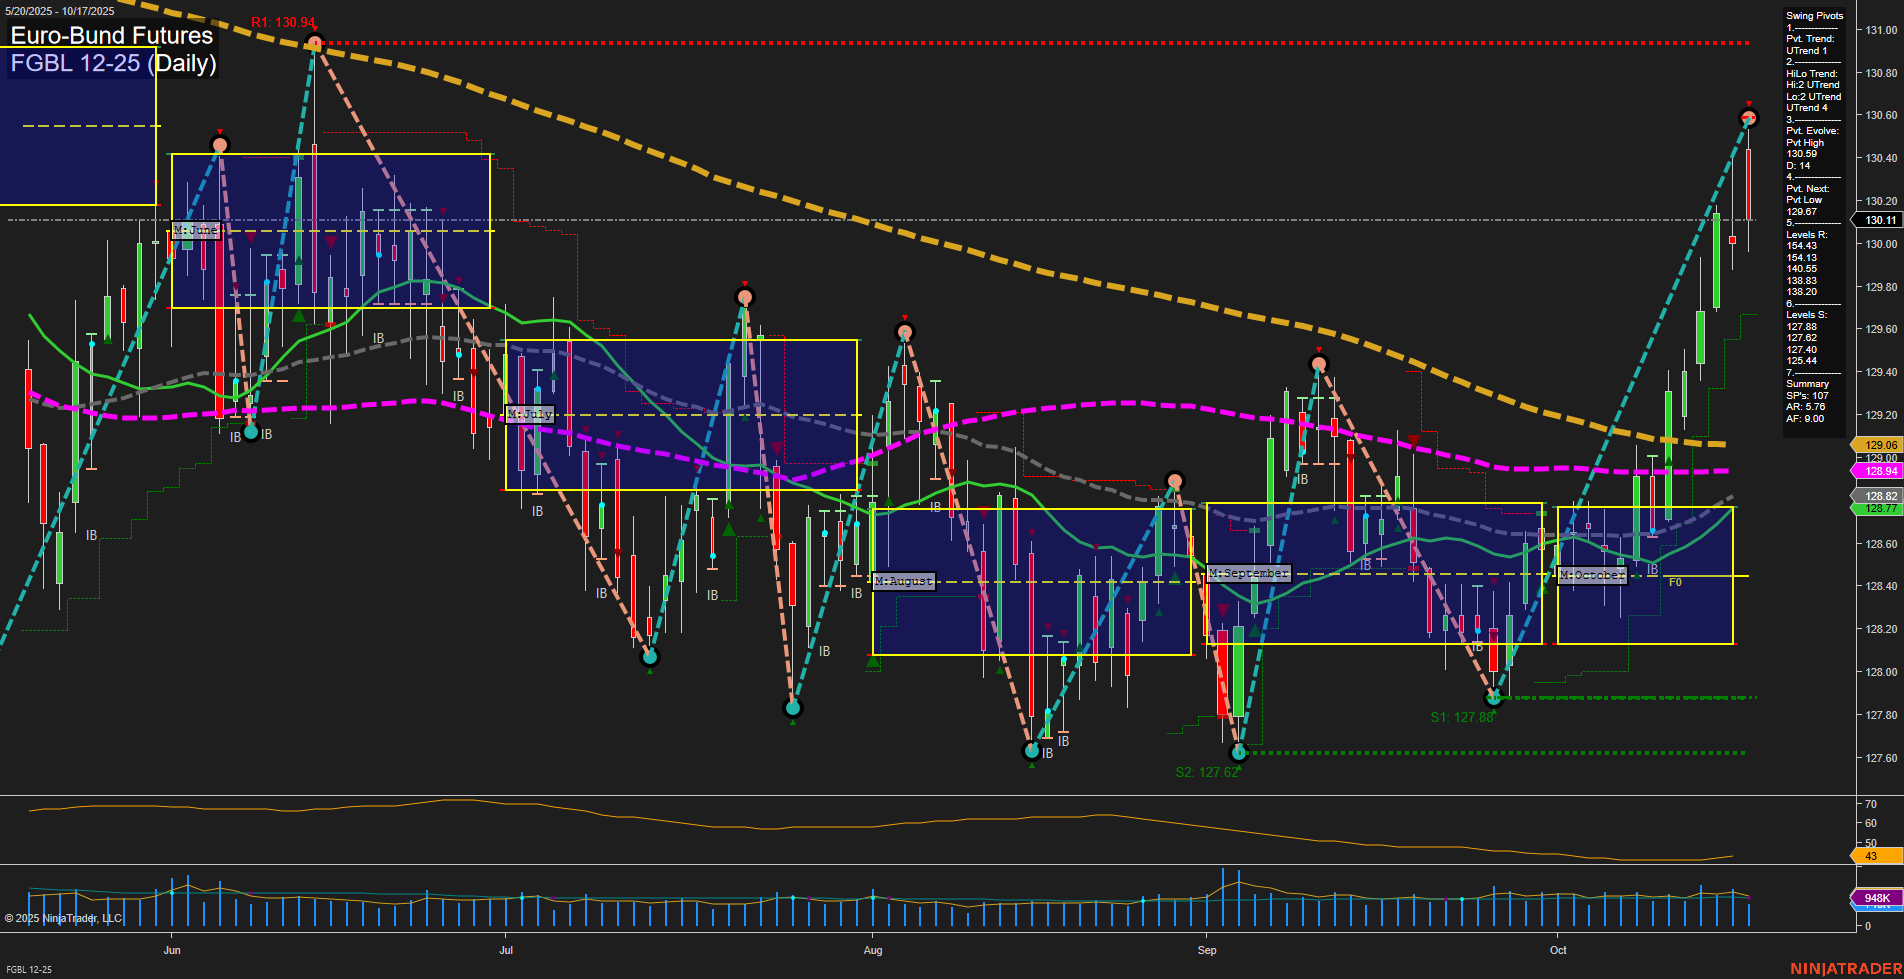
FGBL Euro-Bund Futures Daily Chart Analysis: 2025-Oct-17 07:09 CT
Price Action
- Last: 130.11,
- Bars: Large,
- Mom: Momentum fast.
WSFG Weekly
- Short-Term
- WSFG Current: 109%
- F0%/NTZ' Bias: Price Above,
- WSFG Trend: Up.
MSFG Month Oct
- Intermediate-Term
- MSFG Current: 90%
- F0%/NTZ' Bias: Price Above,
- MSFG Trend: Up.
YSFG Year 2025
- Long-Term
- YSFG Current: -5%
- F0%/NTZ' Bias: Price Below,
- YSFG Trend: Down.
Swing Pivots
- (Short-Term) 1. Pvt. Trend: UTrend,
- (Intermediate-Term) 2. HiLo Trend: UTrend,
- 3. Pvt. Evolve: Pvt high 130.14,
- 4. Pvt. Next: Pvt low 129.07,
- 5. Levels R: 130.94, 130.60, 130.14,
- 6. Levels S: 128.95, 128.82, 127.88, 127.40, 125.44.
Daily Benchmarks
- (Short-Term) 5 Day: 129.06 Up Trend,
- (Short-Term) 10 Day: 128.94 Up Trend,
- (Intermediate-Term) 20 Day: 128.77 Up Trend,
- (Intermediate-Term) 55 Day: 128.82 Up Trend,
- (Long-Term) 100 Day: 129.61 Down Trend,
- (Long-Term) 200 Day: 130.94 Down Trend.
Additional Metrics
- ATR: 65,
- VOLMA: 1,114,077.
Recent Trade Signals
- 13 Oct 2025: Long FGBL 12-25 @ 129.44 Signals.USAR-WSFG
- 10 Oct 2025: Long FGBL 12-25 @ 128.8 Signals.USAR-MSFG
Overall Rating
- Short-Term: Bullish,
- Intermediate-Term: Bullish,
- Long-Term: Bearish.
Key Insights Summary
The FGBL Euro-Bund Futures daily chart shows a strong short- and intermediate-term uptrend, with price action breaking decisively above both the weekly and monthly session fib grid NTZ zones. Large, fast-momentum bars confirm recent bullish acceleration, supported by a series of higher swing highs and higher lows. All short- and intermediate-term moving averages are trending up and stacked below price, reinforcing the bullish structure. However, the long-term trend remains bearish, with the 100- and 200-day moving averages still above current price and sloping down, indicating that the broader trend has not yet reversed. Resistance is clustered near recent highs (130.14–130.94), while support is layered below at 128.95 and 127.88. Recent trade signals have triggered new long entries, aligning with the current momentum. Volatility and volume are elevated, suggesting strong participation in this move. The market is in a potential breakout phase, but faces a test at long-term resistance levels, which could determine if this rally transitions into a sustained long-term reversal or encounters renewed selling pressure.
Chart Analysis ATS AI Generated: 2025-10-17 07:09 for Informational use only, not trading advice. Terms and Risk Disclosure Copyright © 2025. Algo Trading Systems LLC.
