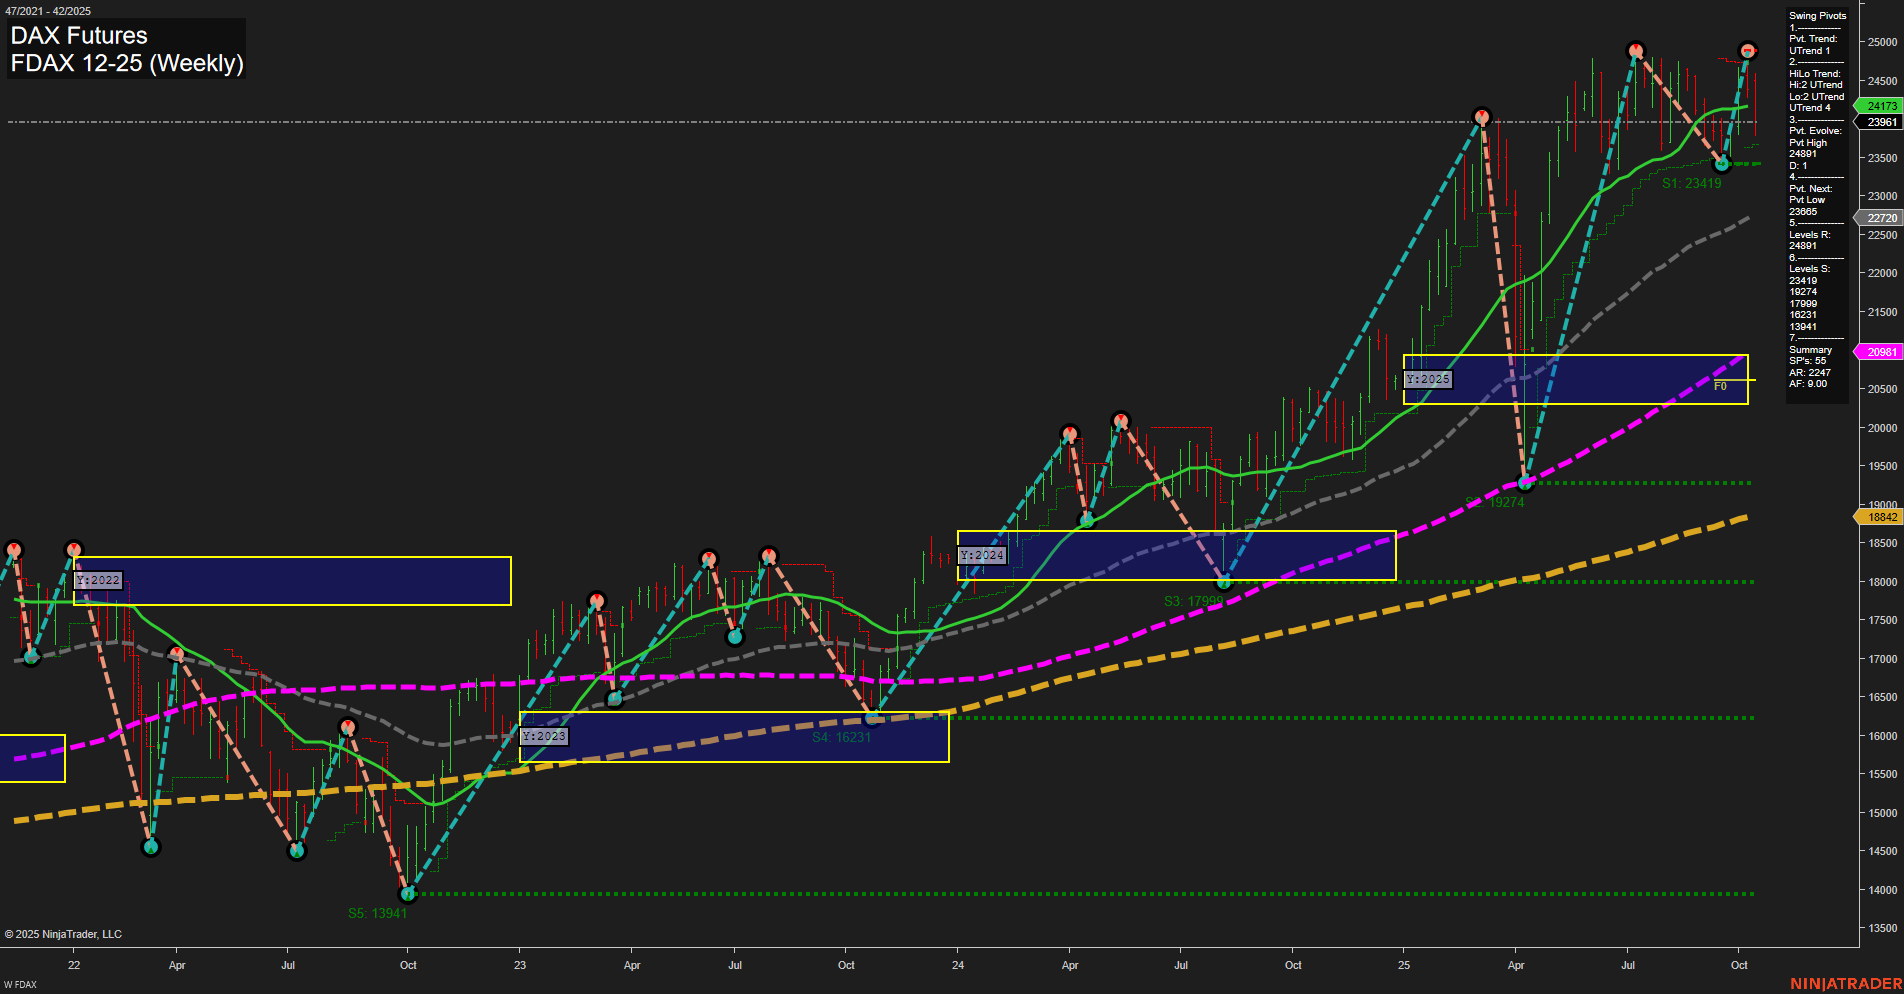
FDAX DAX Futures Weekly Chart Analysis: 2025-Oct-17 07:08 CT
Price Action
- Last: 23961,
- Bars: Medium,
- Mom: Momentum average.
WSFG Weekly
- Short-Term
- WSFG Current: -89%
- F0%/NTZ' Bias: Price Below,
- WSFG Trend: Down.
MSFG Month Oct
- Intermediate-Term
- MSFG Current: -6%
- F0%/NTZ' Bias: Price Below,
- MSFG Trend: Down.
YSFG Year 2025
- Long-Term
- YSFG Current: 105%
- F0%/NTZ' Bias: Price Above,
- YSFG Trend: Up.
Swing Pivots
- (Short-Term) 1. Pvt. Trend: DTrend,
- (Intermediate-Term) 2. HiLo Trend: UTrend,
- 3. Pvt. Evolve: Pvt high 23961,
- 4. Pvt. Next: Pvt low 22720,
- 5. Levels R: 24911, 24501, 23961,
- 6. Levels S: 23419, 22720, 19274, 18842, 17090, 16231, 13941.
Weekly Benchmarks
- (Intermediate-Term) 5 Week: 24357 Down Trend,
- (Intermediate-Term) 10 Week: 24171 Down Trend,
- (Long-Term) 20 Week: 23981 Up Trend,
- (Long-Term) 55 Week: 20981 Up Trend,
- (Long-Term) 100 Week: 20511 Up Trend,
- (Long-Term) 200 Week: 18842 Up Trend.
Recent Trade Signals
- 17 Oct 2025: Short FDAX 12-25 @ 23871 Signals.USAR-MSFG
- 15 Oct 2025: Long FDAX 12-25 @ 24357 Signals.USAR-WSFG
- 10 Oct 2025: Short FDAX 12-25 @ 24397 Signals.USAR.TR120
Overall Rating
- Short-Term: Bearish,
- Intermediate-Term: Neutral,
- Long-Term: Bullish.
Key Insights Summary
The FDAX DAX Futures weekly chart shows a market in transition. Short-term momentum has shifted bearish, with price action below the weekly and monthly session fib grid centers and recent short signals dominating. The most recent swing pivot is a high at 23961, with the next key support at 22720. Intermediate-term trends are mixed: while the HiLo trend remains up, both the 5- and 10-week moving averages have turned down, indicating a possible pause or retracement within the broader uptrend. Long-term structure remains bullish, with price well above the 20-, 55-, 100-, and 200-week moving averages, and the yearly session fib grid trend still up. The market is currently testing resistance near recent highs, with multiple support levels below that could be tested if the short-term downtrend persists. Volatility and choppy price action are evident, with alternating long and short signals in recent weeks, suggesting a period of consolidation or corrective movement within a larger bullish cycle.
Chart Analysis ATS AI Generated: 2025-10-17 07:09 for Informational use only, not trading advice. Terms and Risk Disclosure Copyright © 2025. Algo Trading Systems LLC.
