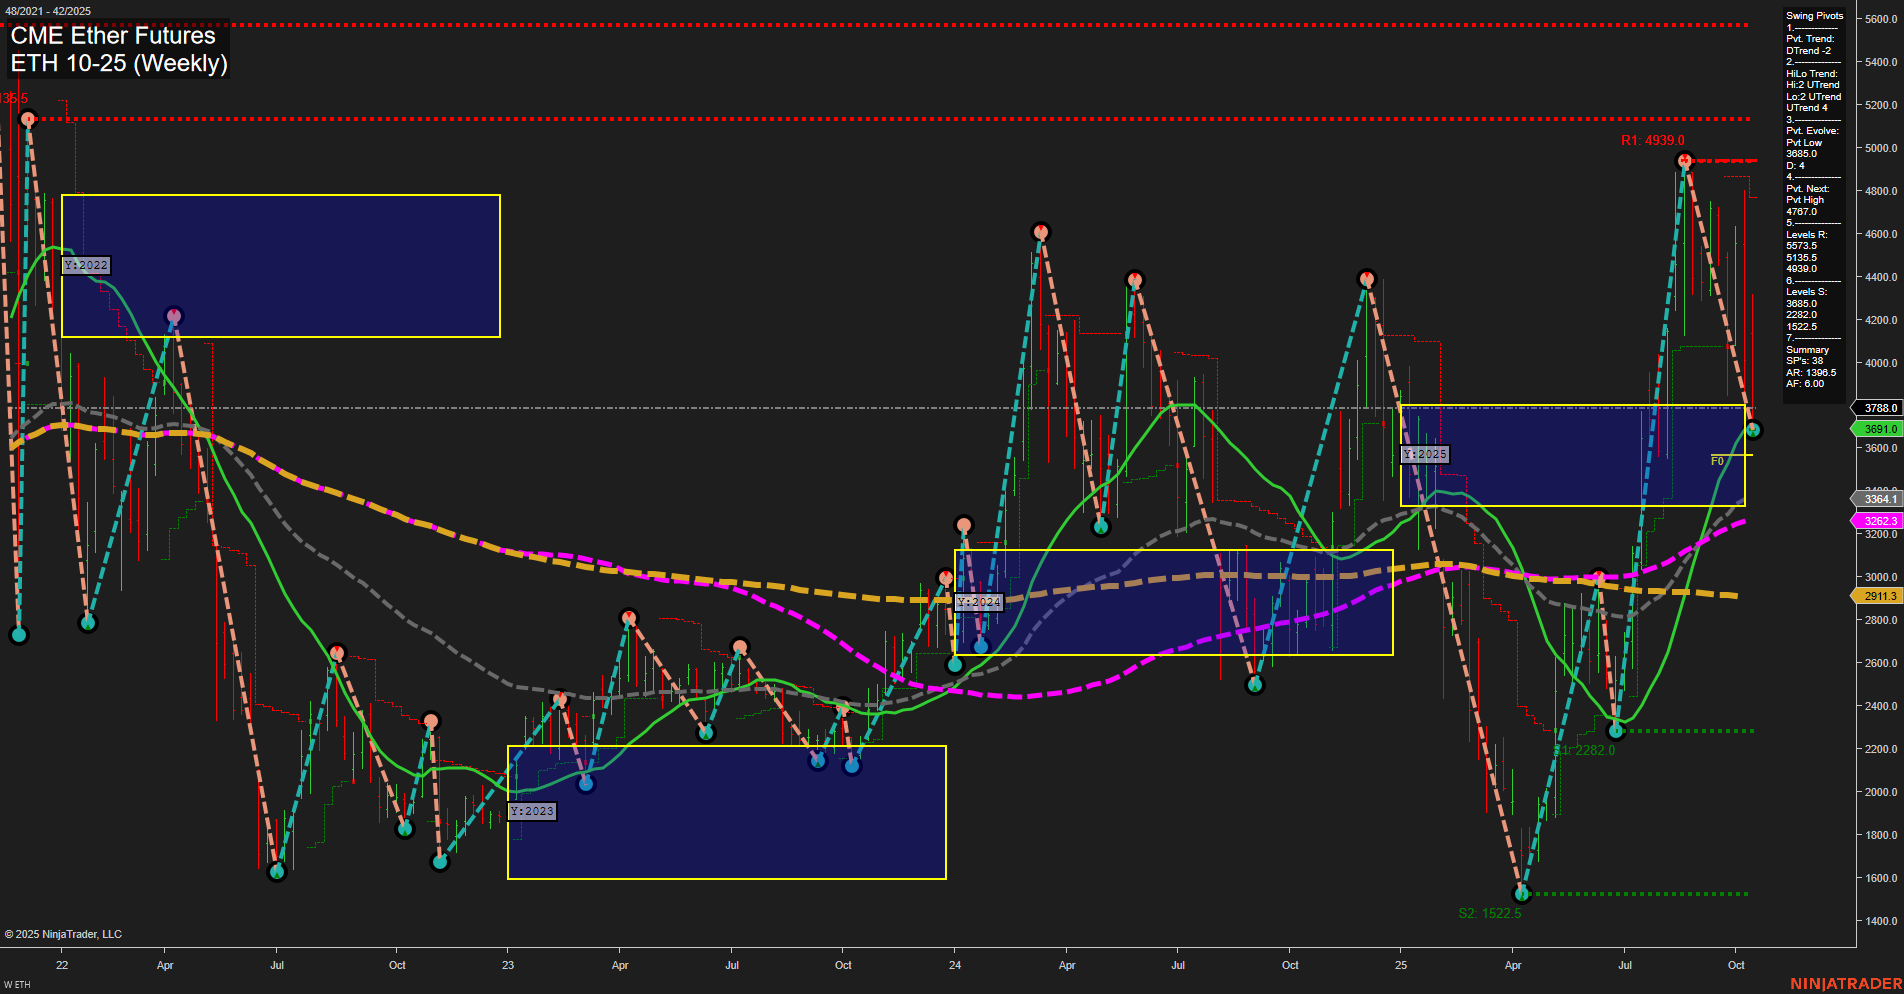
The current weekly chart for ETH CME Ether Futures shows a market in transition. Price action is volatile with large bars and fast momentum, reflecting heightened activity and possible reactions to recent news or macro events. Short-term and intermediate-term Fib grid trends are both down, with price trading below their respective NTZ/F0% levels, confirming a bearish bias in the near term. The swing pivot trend is down short-term, but the intermediate HiLo trend remains up, suggesting a possible tug-of-war between recent selling pressure and underlying support from prior higher lows. Key resistance levels are clustered above, with the most recent swing high at 4939.0, while support is much lower at 3045.0 and below, indicating a wide trading range and potential for sharp moves. The 5 and 10 week moving averages are trending down, reinforcing short-term weakness, but all long-term benchmarks (20, 55, 100, 200 week) are in uptrends, highlighting that the broader structure remains constructive. Recent trade signals have leaned bearish, with multiple short entries triggered in October, though a brief long was attempted and quickly reversed. Overall, the short-term outlook is bearish, the intermediate-term is neutral as the market digests recent swings, and the long-term remains bullish with price still above key yearly benchmarks. The market is currently in a corrective phase within a larger uptrend, with volatility and wide ranges likely to persist as traders navigate between major support and resistance zones.