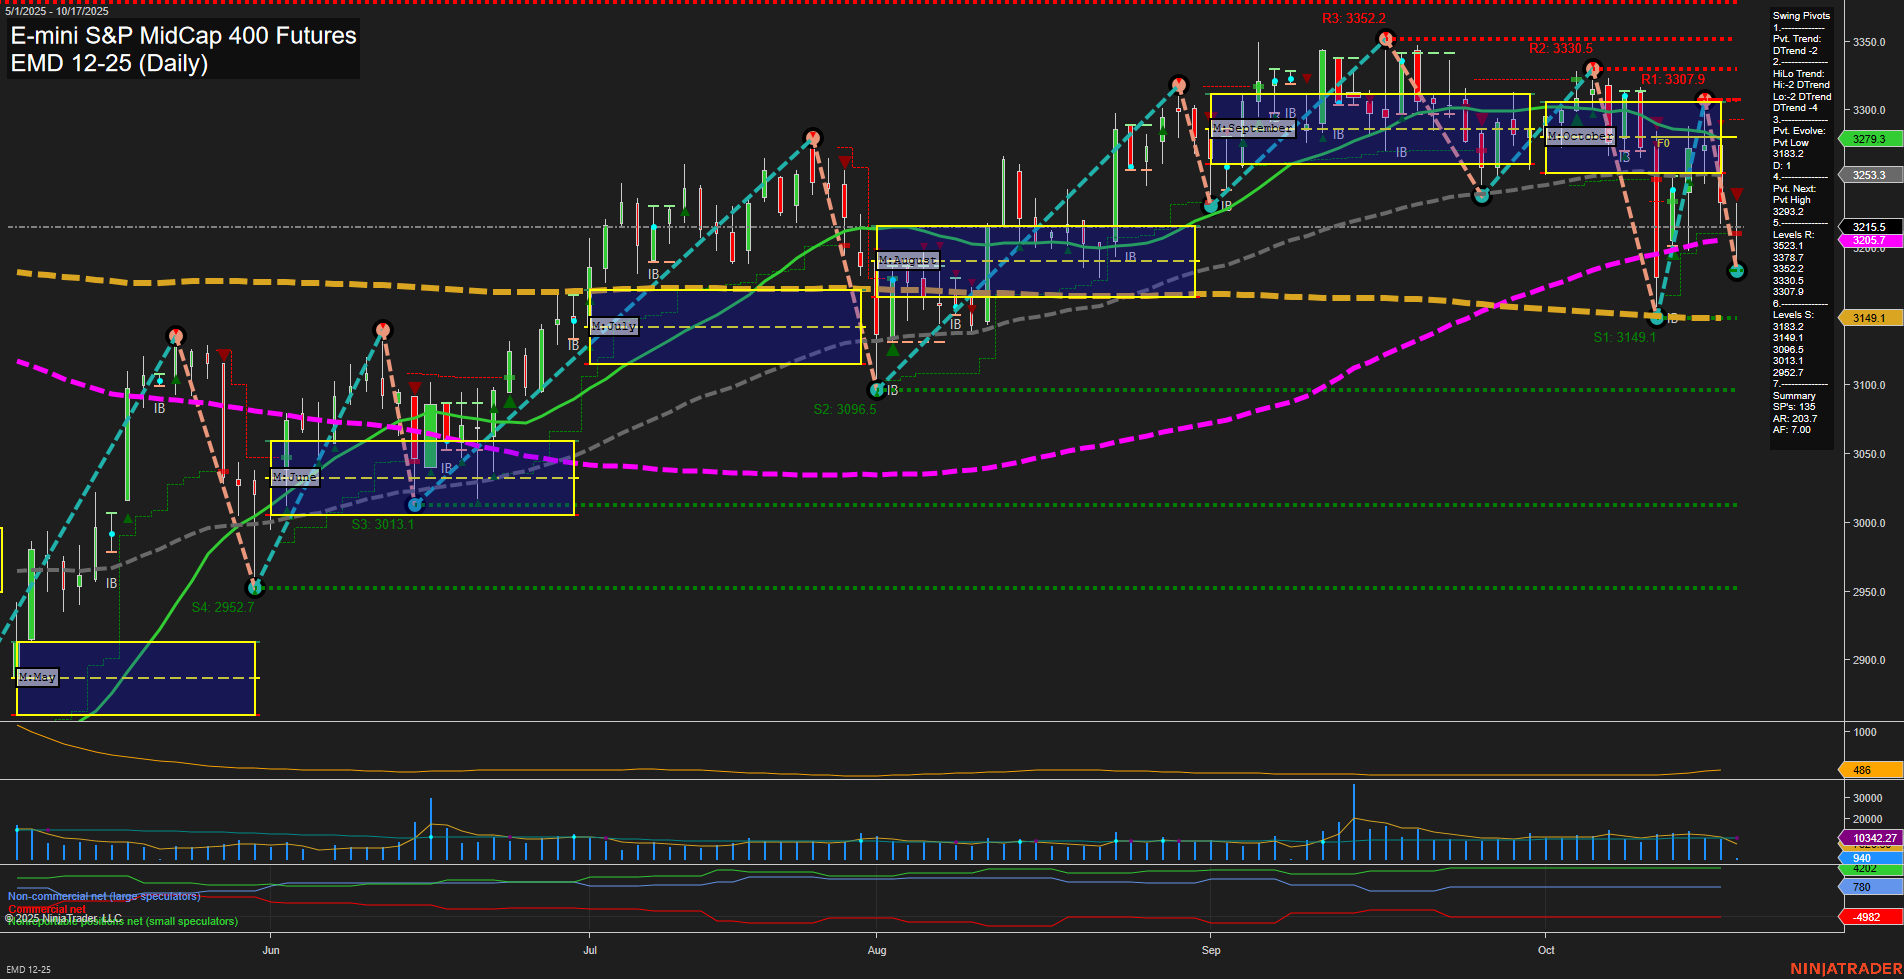
EMD E-mini S&P MidCap 400 Futures Daily Chart Analysis: 2025-Oct-17 07:06 CT
Price Action
- Last: 3215.5,
- Bars: Medium,
- Mom: Momentum slow.
WSFG Weekly
- Short-Term
- WSFG Current: 14%
- F0%/NTZ' Bias: Price Above,
- WSFG Trend: Up.
MSFG Month Oct
- Intermediate-Term
- MSFG Current: -29%
- F0%/NTZ' Bias: Price Below,
- MSFG Trend: Down.
YSFG Year 2025
- Long-Term
- YSFG Current: 0%
- F0%/NTZ' Bias: Price Neutral,
- YSFG Trend: Neutral.
Swing Pivots
- (Short-Term) 1. Pvt. Trend: DTrend,
- (Intermediate-Term) 2. HiLo Trend: DTrend,
- 3. Pvt. Evolve: Pvt Low 3182,
- 4. Pvt. Next: Pvt High 3293.2,
- 5. Levels R: 3352.2, 3330.5, 3307.9, 3293.2,
- 6. Levels S: 3182, 3149.1, 3096.5, 3013.1, 2952.7.
Daily Benchmarks
- (Short-Term) 5 Day: 3232.3 Down Trend,
- (Short-Term) 10 Day: 3255.3 Down Trend,
- (Intermediate-Term) 20 Day: 3279.3 Down Trend,
- (Intermediate-Term) 55 Day: 3215.5 Down Trend,
- (Long-Term) 100 Day: 3149.1 Up Trend,
- (Long-Term) 200 Day: 3149.1 Up Trend.
Additional Metrics
Recent Trade Signals
- 16 Oct 2025: Short EMD 12-25 @ 3232.5 Signals.USAR.TR120
- 16 Oct 2025: Short EMD 12-25 @ 3240.7 Signals.USAR-MSFG
- 13 Oct 2025: Long EMD 12-25 @ 3217.2 Signals.USAR-WSFG
- 10 Oct 2025: Short EMD 12-25 @ 3213.1 Signals.USAR.TR720
Overall Rating
- Short-Term: Bearish,
- Intermediate-Term: Bearish,
- Long-Term: Neutral.
Key Insights Summary
The EMD futures daily chart reflects a market in transition, with short- and intermediate-term trends turning bearish as evidenced by the downward direction of swing pivots and all key short/intermediate moving averages. Price is currently below the monthly session fib grid (MSFG) neutral zone, confirming intermediate-term weakness, while the weekly session fib grid (WSFG) still shows some short-term resilience with price above its neutral zone, though this is at risk given the recent momentum. The most recent swing pivot is a low at 3182, with the next resistance at 3293.2 and multiple overhead resistance levels stacked above, suggesting rallies may face selling pressure. Support is layered below at 3182, 3149.1, and further down, indicating potential for further downside tests. Volatility remains moderate (ATR 445), and volume is steady but not elevated, pointing to a lack of strong conviction from either bulls or bears. Recent trade signals have favored the short side, aligning with the prevailing downtrend. The long-term trend remains neutral, with price still above the 100- and 200-day moving averages, but the risk of a deeper correction is present if support levels break. Overall, the market is in a corrective phase, with a bearish bias in the short and intermediate term, and traders are likely watching for either a breakdown of key support or signs of stabilization for the next directional move.
Chart Analysis ATS AI Generated: 2025-10-17 07:06 for Informational use only, not trading advice. Terms and Risk Disclosure Copyright © 2025. Algo Trading Systems LLC.
