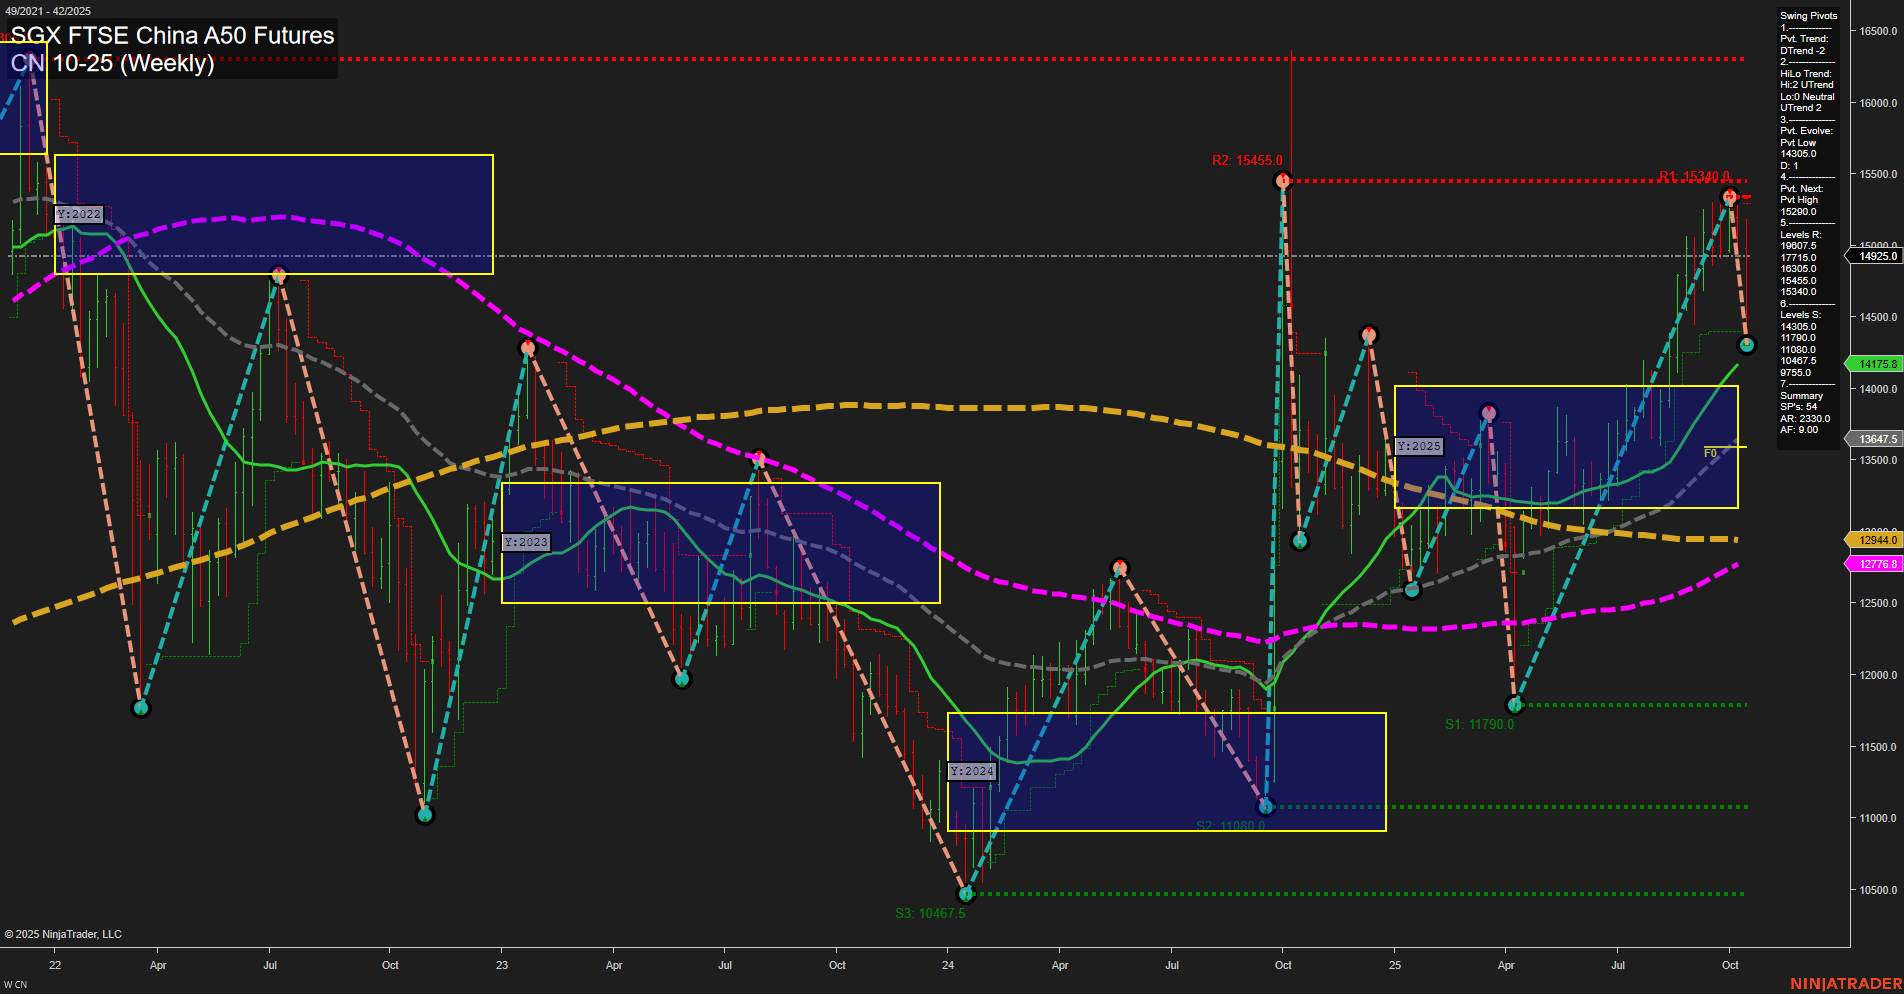
CN SGX FTSE China A50 Futures Weekly Chart Analysis: 2025-Oct-17 07:05 CT
Price Action
- Last: 14930.0,
- Bars: Large,
- Mom: Momentum fast.
WSFG Weekly
- Short-Term
- WSFG Current: NA%
- F0%/NTZ' Bias: Price Neutral,
- WSFG Trend: Neutral.
MSFG Month Oct
- Intermediate-Term
- MSFG Current: NA%
- F0%/NTZ' Bias: Price Neutral,
- MSFG Trend: Neutral.
YSFG Year 2025
- Long-Term
- YSFG Current: NA%
- F0%/NTZ' Bias: Price Neutral,
- YSFG Trend: Neutral.
Swing Pivots
- (Short-Term) 1. Pvt. Trend: DTrend,
- (Intermediate-Term) 2. HiLo Trend: U2D Neutral,
- 3. Pvt. Evolve: Pvt Low 13405.0,
- 4. Pvt. Next: Pvt High 15455.0,
- 5. Levels R: 15455.0, 15340.0,
- 6. Levels S: 14175.8, 13405.0, 12778.8, 11790.0, 10467.5.
Weekly Benchmarks
- (Intermediate-Term) 5 Week: 14175.8 Up Trend,
- (Intermediate-Term) 10 Week: 13467.5 Up Trend,
- (Long-Term) 20 Week: 12944.0 Up Trend,
- (Long-Term) 55 Week: 12778.8 Up Trend,
- (Long-Term) 100 Week: 13647.5 Up Trend,
- (Long-Term) 200 Week: 13300.0 Up Trend.
Overall Rating
- Short-Term: Neutral,
- Intermediate-Term: Neutral,
- Long-Term: Bullish.
Key Insights Summary
The CN SGX FTSE China A50 Futures weekly chart shows a strong upward move in recent weeks, with large bars and fast momentum pushing price to 14930.0. Despite this, the short-term and intermediate-term Fib grid trends remain neutral, indicating a lack of clear directional conviction at these timeframes. The swing pivot structure highlights a recent downtrend in the short-term, but the intermediate-term trend is neutral, suggesting a transition phase. Resistance is clustered near 15455.0 and 15340.0, while support is layered below at 14175.8, 13405.0, and further down. All benchmark moving averages from 5 to 200 weeks are in uptrends, reinforcing a bullish long-term backdrop. The market appears to be in a consolidation or potential topping phase after a strong rally, with price testing upper resistance levels. Volatility is elevated, and the structure suggests the market is at a decision point, with the potential for either a continuation higher if resistance breaks, or a retracement if sellers defend these levels.
Chart Analysis ATS AI Generated: 2025-10-17 07:06 for Informational use only, not trading advice. Terms and Risk Disclosure Copyright © 2025. Algo Trading Systems LLC.
