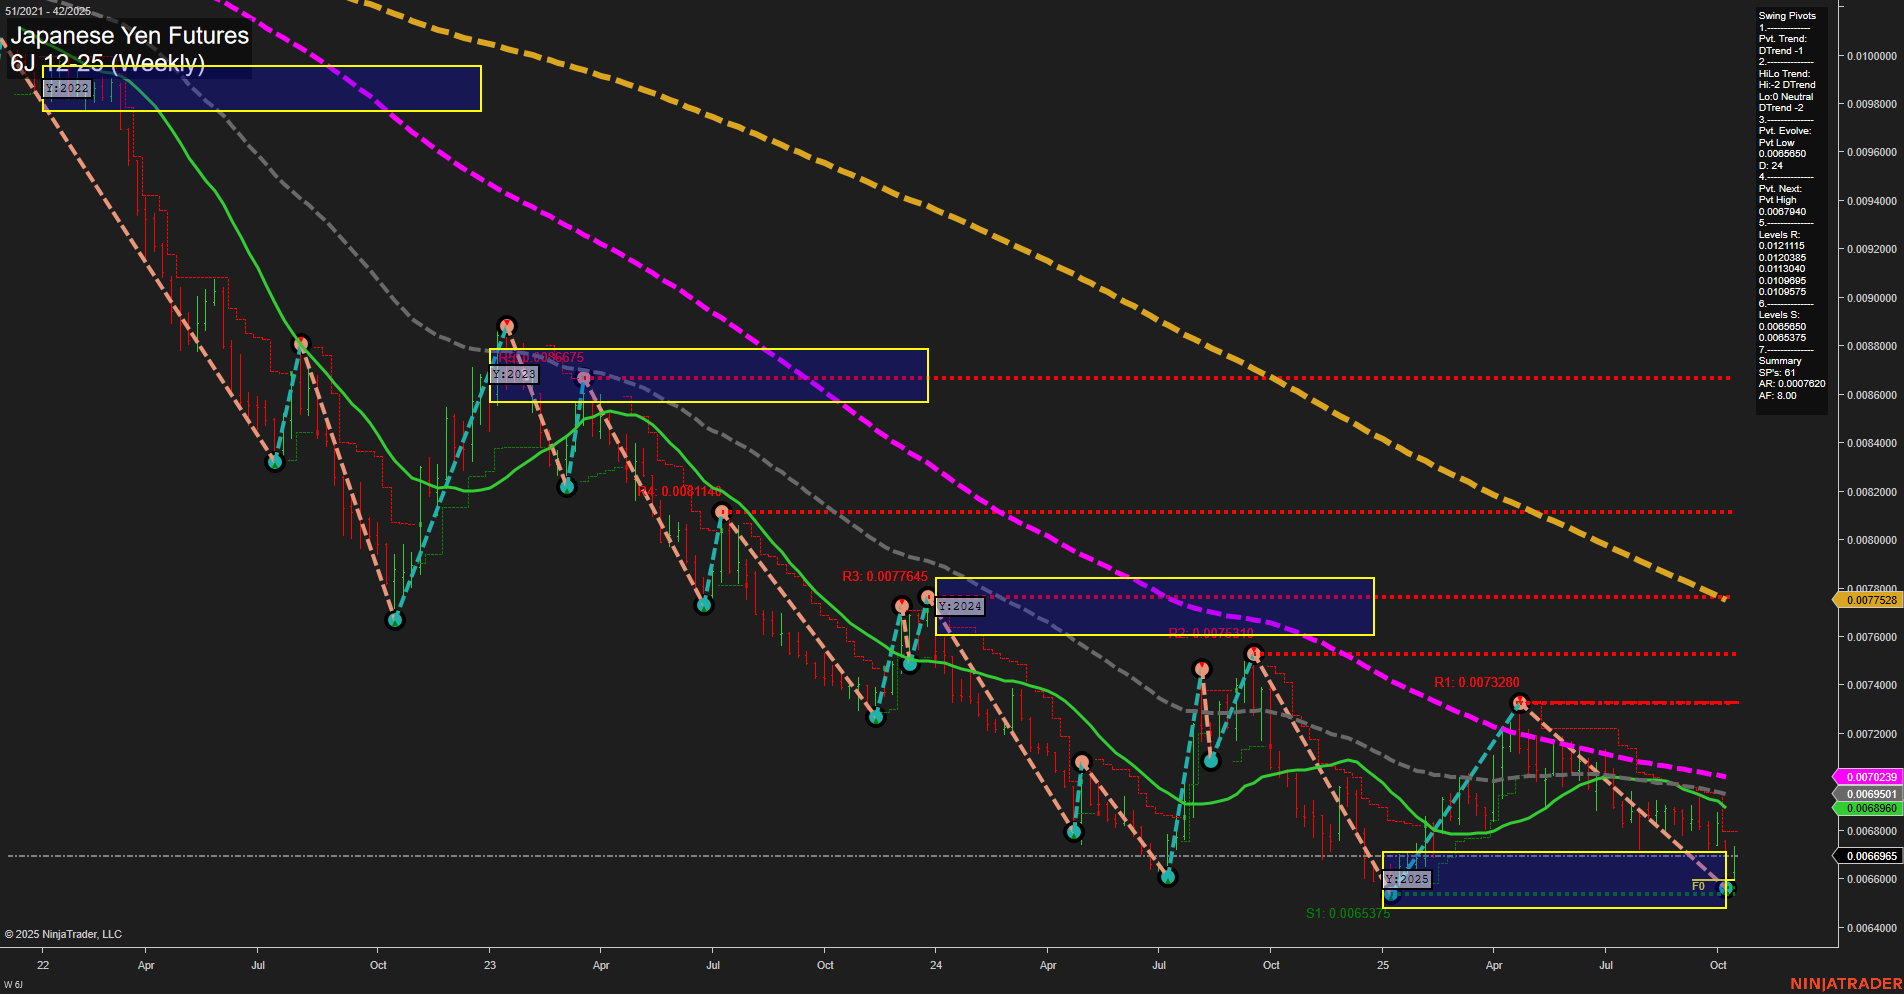
6J Japanese Yen Futures Weekly Chart Analysis: 2025-Oct-17 07:03 CT
Price Action
- Last: 0.006657,
- Bars: Medium,
- Mom: Momentum slow.
WSFG Weekly
- Short-Term
- WSFG Current: 41%
- F0%/NTZ' Bias: Price Above,
- WSFG Trend: Up.
MSFG Month Oct
- Intermediate-Term
- MSFG Current: -45%
- F0%/NTZ' Bias: Price Below,
- MSFG Trend: Down.
YSFG Year 2025
- Long-Term
- YSFG Current: 8%
- F0%/NTZ' Bias: Price Above,
- YSFG Trend: Up.
Swing Pivots
- (Short-Term) 1. Pvt. Trend: DTrend,
- (Intermediate-Term) 2. HiLo Trend: DTrend,
- 3. Pvt. Evolve: Pvt low 0.0066575,
- 4. Pvt. Next: Pvt high 0.0070400,
- 5. Levels R: 0.0077645, 0.0073280, 0.0071100, 0.0070395, 0.0069875,
- 6. Levels S: 0.0066575, 0.0065800, 0.0065375.
Weekly Benchmarks
- (Intermediate-Term) 5 Week: 0.0068591 Down Trend,
- (Intermediate-Term) 10 Week: 0.0069560 Down Trend,
- (Long-Term) 20 Week: 0.0070239 Down Trend,
- (Long-Term) 55 Week: 0.0072390 Down Trend,
- (Long-Term) 100 Week: 0.0077528 Down Trend,
- (Long-Term) 200 Week: 0.0080000 Down Trend.
Recent Trade Signals
- 16 Oct 2025: Long 6J 12-25 @ 0.006657 Signals.USAR-WSFG
- 10 Oct 2025: Long 6J 12-25 @ 0.006626 Signals.USAR.TR120
Overall Rating
- Short-Term: Neutral,
- Intermediate-Term: Bearish,
- Long-Term: Bearish.
Key Insights Summary
The Japanese Yen futures have recently shown a slow momentum bounce from a key swing low, with price action currently sitting just above the short-term NTZ/F0% level, suggesting a potential attempt at a short-term reversal. However, both the intermediate and long-term trends remain firmly bearish, as indicated by the persistent downtrend in all major moving averages and the swing pivot structure. Resistance levels are stacked above, with the next significant pivot high at 0.0070400 and multiple resistance bands overhead, while support is anchored at the recent swing low. The recent long signals reflect a possible short-term countertrend move, but the broader context remains dominated by downward pressure, with rallies likely to face strong resistance. The market is in a transitional phase, with short-term upside attempts occurring within a larger bearish framework, and volatility may increase as price tests these key levels.
Chart Analysis ATS AI Generated: 2025-10-17 07:03 for Informational use only, not trading advice. Terms and Risk Disclosure Copyright © 2025. Algo Trading Systems LLC.
