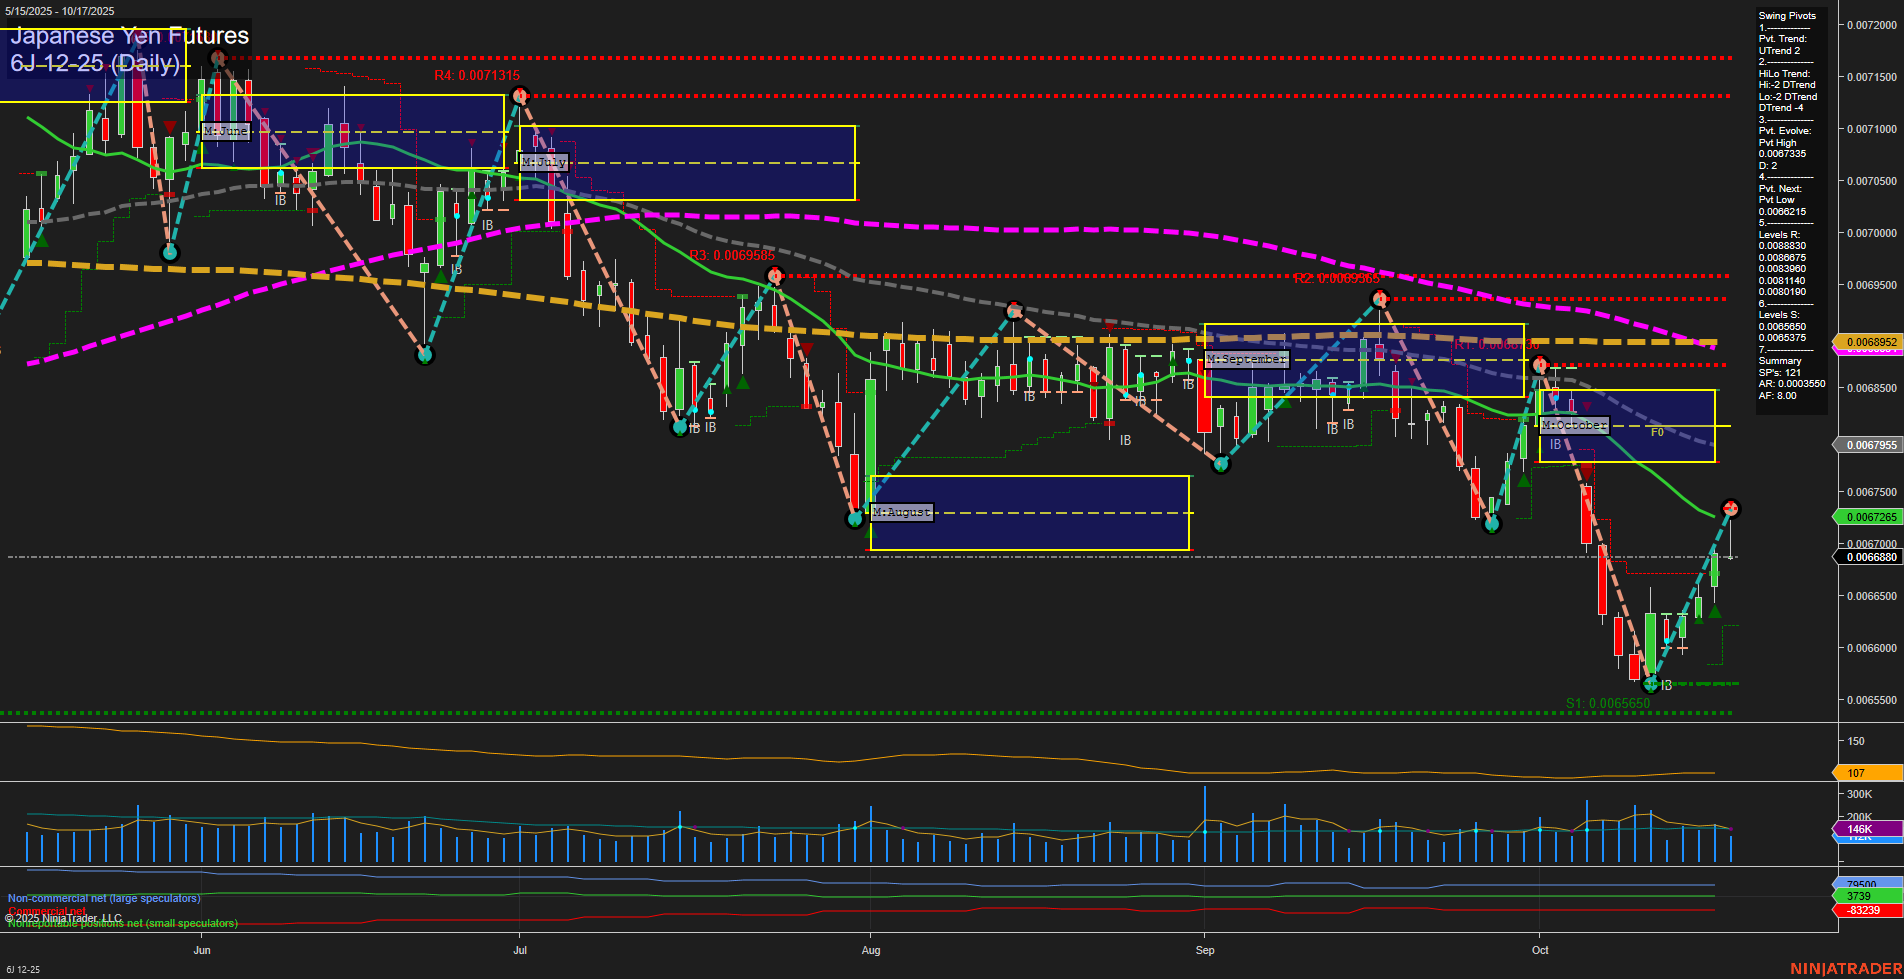
6J Japanese Yen Futures Daily Chart Analysis: 2025-Oct-17 07:25 CT
Price Action
- Last: 0.0067256,
- Bars: Medium,
- Mom: Momentum average.
WSFG Weekly
- Short-Term
- WSFG Current: 41%
- F0%/NTZ' Bias: Price Above,
- WSFG Trend: Up.
MSFG Month Oct
- Intermediate-Term
- MSFG Current: -45%
- F0%/NTZ' Bias: Price Below,
- MSFG Trend: Down.
YSFG Year 2025
- Long-Term
- YSFG Current: 8%
- F0%/NTZ' Bias: Price Above,
- YSFG Trend: Up.
Swing Pivots
- (Short-Term) 1. Pvt. Trend: UTrend,
- (Intermediate-Term) 2. HiLo Trend: DTrend,
- 3. Pvt. Evolve: Pvt High 0.0067335,
- 4. Pvt. Next: Pvt Low 0.0066215,
- 5. Levels R: 0.0071315, 0.0069985, 0.0069655, 0.0069065, 0.0068800, 0.0068100,
- 6. Levels S: 0.0066570, 0.0065375.
Daily Benchmarks
- (Short-Term) 5 Day: 0.0066580 Up Trend,
- (Short-Term) 10 Day: 0.0066550 Up Trend,
- (Intermediate-Term) 20 Day: 0.0067555 Down Trend,
- (Intermediate-Term) 55 Day: 0.0068952 Down Trend,
- (Long-Term) 100 Day: 0.0070210 Down Trend,
- (Long-Term) 200 Day: 0.0069522 Down Trend.
Additional Metrics
Recent Trade Signals
- 16 Oct 2025: Long 6J 12-25 @ 0.006657 Signals.USAR-WSFG
- 10 Oct 2025: Long 6J 12-25 @ 0.006626 Signals.USAR.TR120
Overall Rating
- Short-Term: Bullish,
- Intermediate-Term: Bearish,
- Long-Term: Neutral.
Key Insights Summary
The 6J Japanese Yen Futures daily chart shows a recent shift in short-term momentum, with price rebounding from support and breaking above both the 5-day and 10-day moving averages, supported by recent long trade signals. The short-term swing pivot trend has turned up (UTrend), but the intermediate-term (monthly) MSFG remains in a downtrend, with price still below the monthly NTZ and 20/55/100/200-day moving averages all trending down. This suggests the current move is a countertrend rally within a broader bearish structure. Resistance levels are stacked above, with the nearest at 0.0067335 and significant overhead supply up to 0.0071315. Support is established at 0.0066570 and 0.0065375. Volatility (ATR) and volume (VOLMA) are moderate, indicating a stable but not explosive environment. The long-term trend is neutral, as the yearly grid is slightly positive but not strongly directional. Overall, the chart reflects a short-term bullish bounce within a larger intermediate-term downtrend, with the potential for further upside limited by strong resistance and the prevailing longer-term bearish context.
Chart Analysis ATS AI Generated: 2025-10-17 07:25 for Informational use only, not trading advice. Terms and Risk Disclosure Copyright © 2025. Algo Trading Systems LLC.
