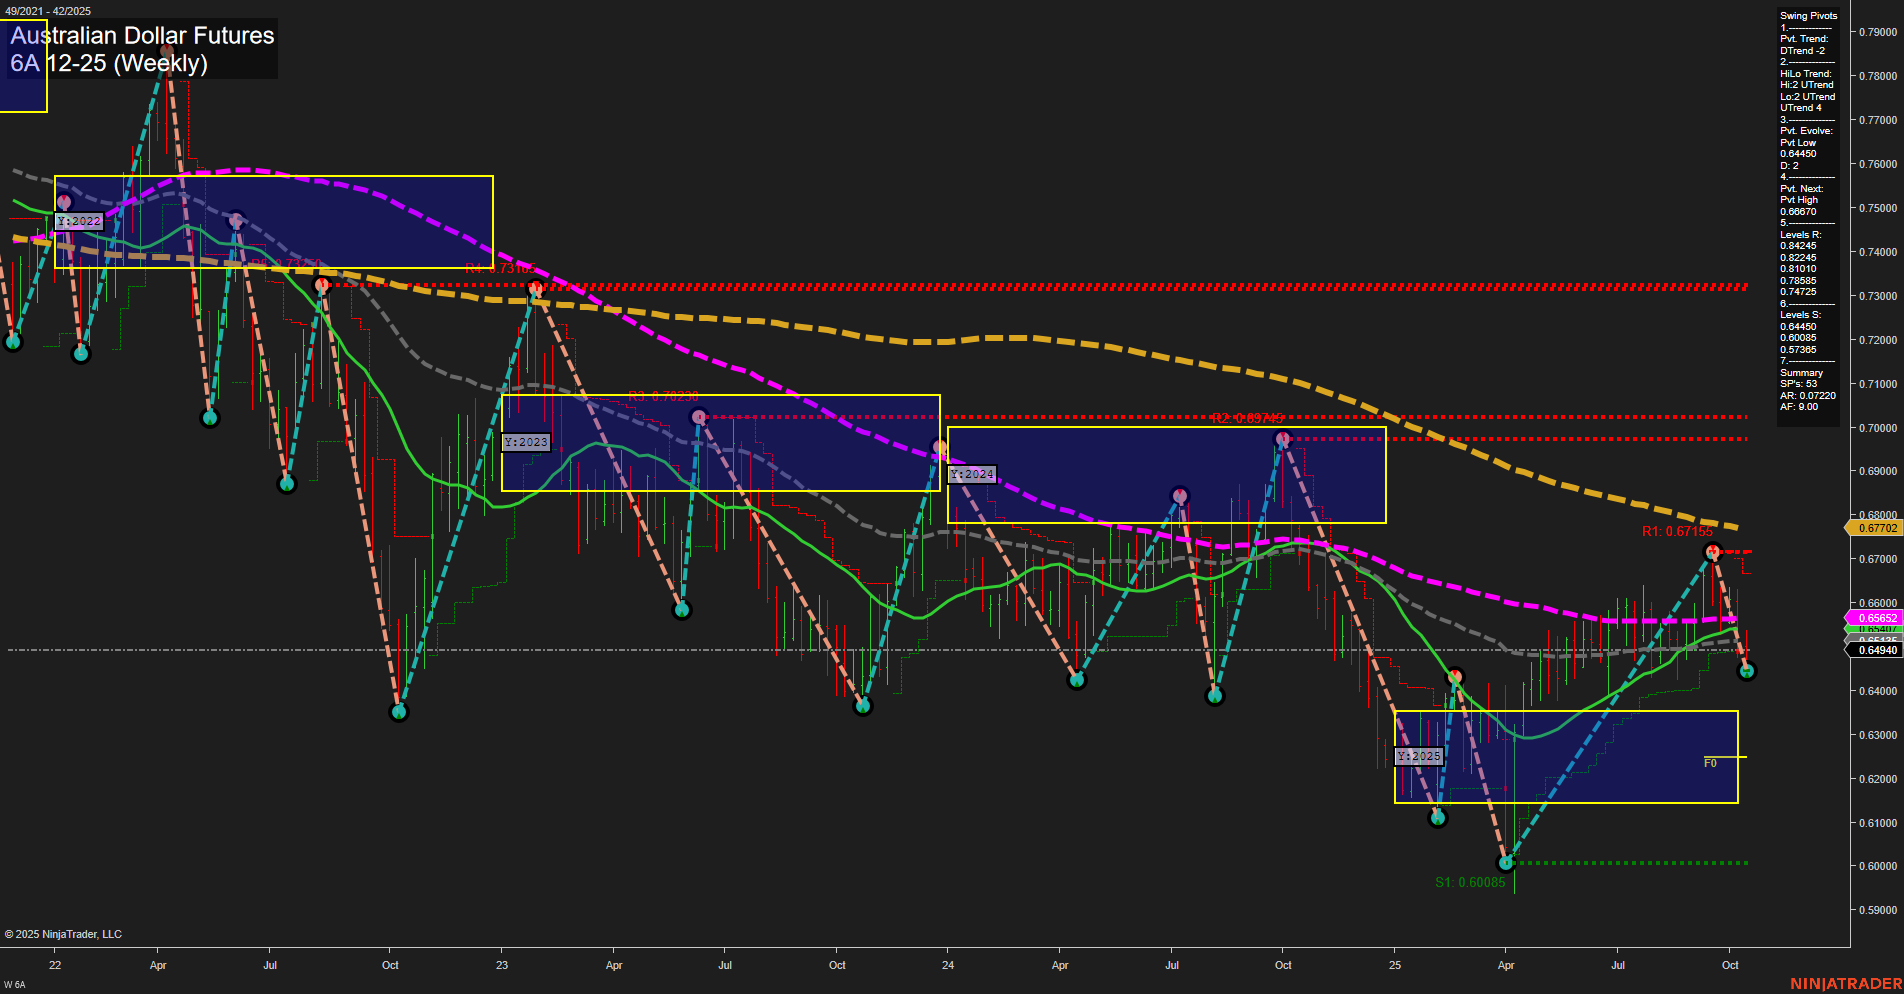
6A Australian Dollar Futures Weekly Chart Analysis: 2025-Oct-17 07:00 CT
Price Action
- Last: 0.64720,
- Bars: Medium,
- Mom: Momentum average.
WSFG Weekly
- Short-Term
- WSFG Current: NA%
- F0%/NTZ' Bias: Price Neutral,
- WSFG Trend: Neutral.
MSFG Month Oct
- Intermediate-Term
- MSFG Current: NA%
- F0%/NTZ' Bias: Price Neutral,
- MSFG Trend: Neutral.
YSFG Year 2025
- Long-Term
- YSFG Current: NA%
- F0%/NTZ' Bias: Price Neutral,
- YSFG Trend: Neutral.
Swing Pivots
- (Short-Term) 1. Pvt. Trend: DTrend,
- (Intermediate-Term) 2. HiLo Trend: UTrend,
- 3. Pvt. Evolve: Pvt Low 0.64494,
- 4. Pvt. Next: Pvt High 0.66970,
- 5. Levels R: 0.67155, 0.66970, 0.66105, 0.65527, 0.64845,
- 6. Levels S: 0.64494, 0.63086, 0.60085.
Weekly Benchmarks
- (Intermediate-Term) 5 Week: 0.65527 Down Trend,
- (Intermediate-Term) 10 Week: 0.64845 Down Trend,
- (Long-Term) 20 Week: 0.65552 Up Trend,
- (Long-Term) 55 Week: 0.67702 Down Trend,
- (Long-Term) 100 Week: 0.66970 Down Trend,
- (Long-Term) 200 Week: 0.68949 Down Trend.
Recent Trade Signals
- 17 Oct 2025: Short 6A 12-25 @ 0.64725 Signals.USAR-WSFG
- 17 Oct 2025: Short 6A 12-25 @ 0.6472 Signals.USAR.TR120
Overall Rating
- Short-Term: Bearish,
- Intermediate-Term: Neutral,
- Long-Term: Bearish.
Key Insights Summary
The 6A Australian Dollar Futures weekly chart shows a market in transition, with short-term momentum turning bearish as indicated by the recent swing pivot downtrend and fresh short trade signals. Price has pulled back from resistance near 0.67155 and is now testing support at 0.64494, with medium-sized bars and average momentum suggesting a controlled but persistent move lower. Intermediate-term trends remain neutral, as the HiLo trend is still up, but the 5- and 10-week moving averages have shifted to a downtrend, reflecting recent weakness. Long-term structure is bearish, with all major long-term moving averages (55, 100, 200 week) trending down and price trading below these benchmarks. The market is consolidating within the yearly session fib grid, with no clear directional bias from the NTZ zones, but the overall technical picture favors further downside risk unless a strong reversal emerges above key resistance levels. The environment is characterized by a recent rejection at higher levels, a sequence of lower highs, and a test of multi-month support, suggesting a cautious stance as the market seeks direction into year-end.
Chart Analysis ATS AI Generated: 2025-10-17 07:01 for Informational use only, not trading advice. Terms and Risk Disclosure Copyright © 2025. Algo Trading Systems LLC.
