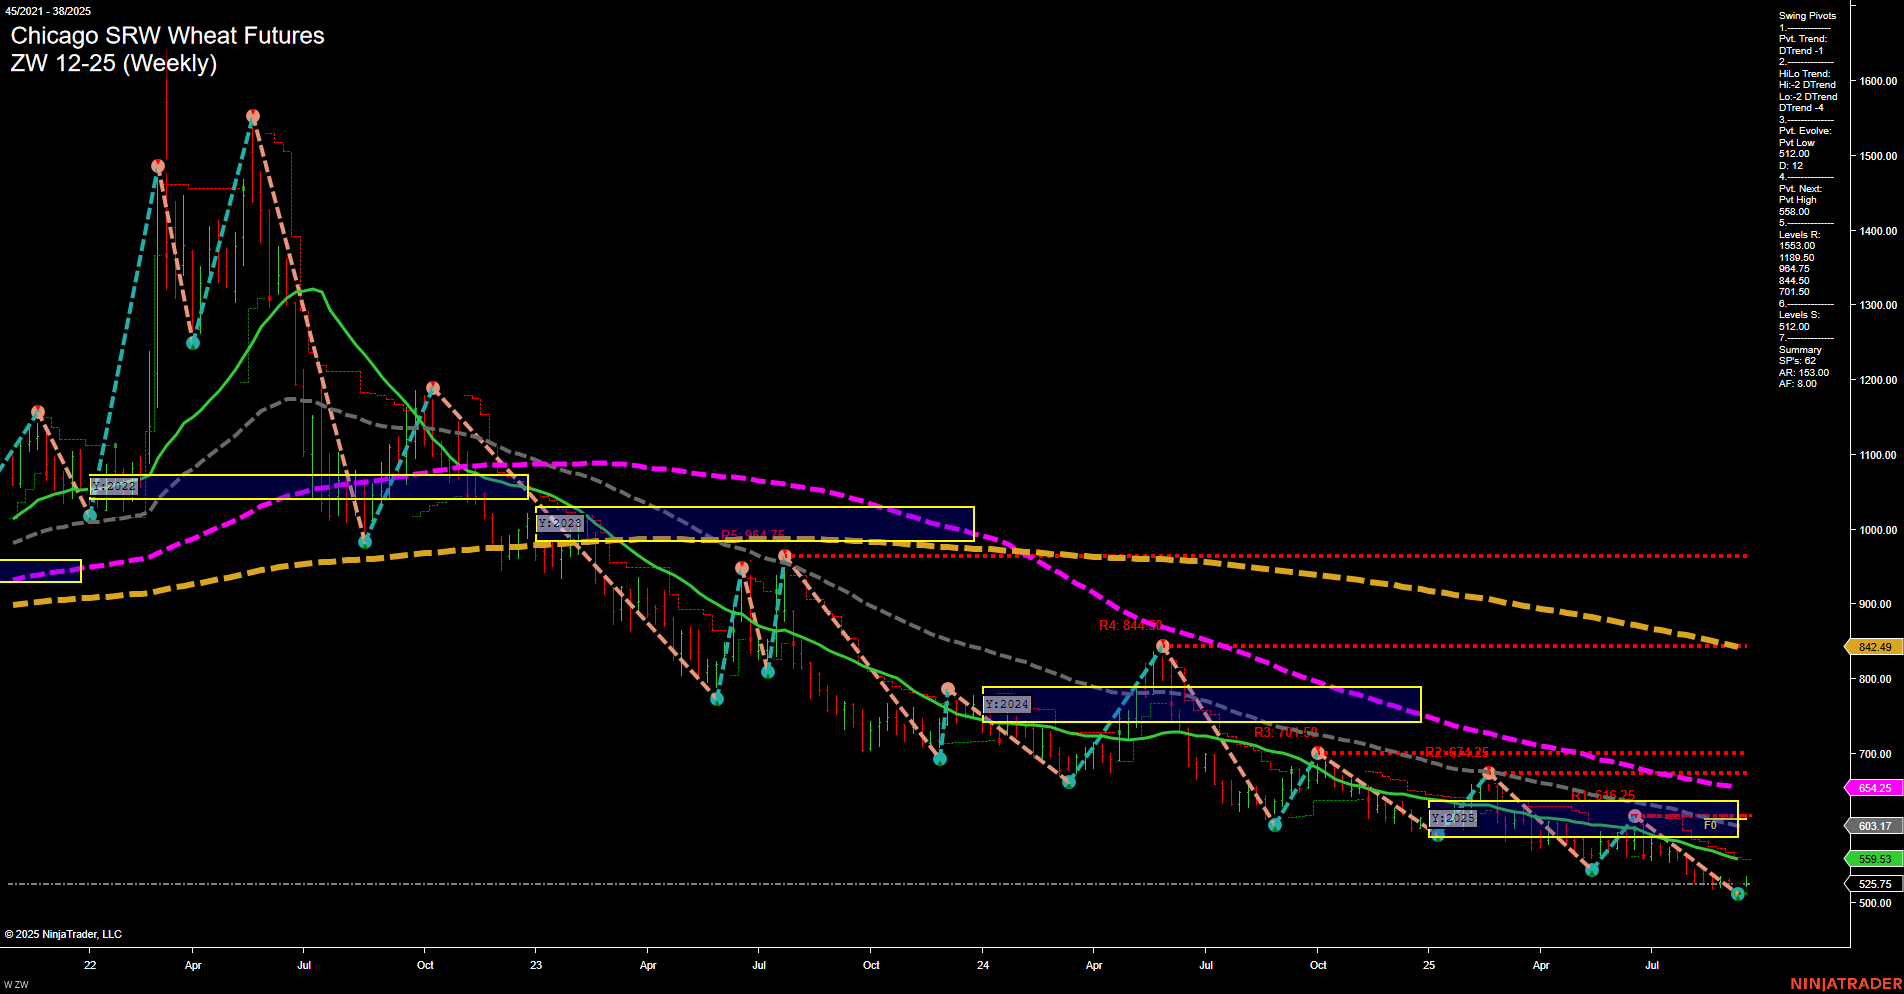
ZW Chicago SRW Wheat Futures Weekly Chart Analysis: 2025-Sep-19 07:22 CT
Price Action
- Last: 525.5,
- Bars: Small,
- Mom: Momentum slow.
WSFG Weekly
- Short-Term
- WSFG Current: 13%
- F0%/NTZ' Bias: Price Above,
- WSFG Trend: Up.
MSFG Month Sep
- Intermediate-Term
- MSFG Current: -14%
- F0%/NTZ' Bias: Price Below,
- MSFG Trend: Down.
YSFG Year 2025
- Long-Term
- YSFG Current: -37%
- F0%/NTZ' Bias: Price Below,
- YSFG Trend: Down.
Swing Pivots
- (Short-Term) 1. Pvt. Trend: DTrend,
- (Intermediate-Term) 2. HiLo Trend: DTrend,
- 3. Pvt. Evolve: Pvt Low 512.00,
- 4. Pvt. Next: Pvt High 586.00,
- 5. Levels R: 964.75, 884.50, 674.25, 546.25,
- 6. Levels S: 512.00.
Weekly Benchmarks
- (Intermediate-Term) 5 Week: 559.53 Down Trend,
- (Intermediate-Term) 10 Week: 603.17 Down Trend,
- (Long-Term) 20 Week: 654.25 Down Trend,
- (Long-Term) 55 Week: 842.49 Down Trend,
- (Long-Term) 100 Week: 0.00,
- (Long-Term) 200 Week: 0.00.
Recent Trade Signals
- 19 Sep 2025: Short ZW 12-25 @ 525.5 Signals.USAR-MSFG
- 18 Sep 2025: Short ZW 12-25 @ 525.25 Signals.USAR.TR120
- 16 Sep 2025: Long ZW 12-25 @ 533.5 Signals.USAR.TR720
- 15 Sep 2025: Long ZW 12-25 @ 524.75 Signals.USAR-WSFG
Overall Rating
- Short-Term: Neutral,
- Intermediate-Term: Bearish,
- Long-Term: Bearish.
Key Insights Summary
The ZW Chicago SRW Wheat Futures weekly chart shows a market that remains under significant long-term and intermediate-term pressure, with both the YSFG and MSFG trends pointing down and price trading well below key yearly and monthly session fib grid levels. The short-term WSFG trend has recently turned up, but this is occurring within a broader context of persistent downtrends, as confirmed by the swing pivot trends and all major moving averages sloping downward. Price action is subdued, with small bars and slow momentum, indicating a lack of strong directional conviction in the very near term. The most recent swing pivot is a low at 512.00, with the next resistance pivot high at 586.00, and major resistance levels remain far overhead. Recent trade signals have been mixed, with both short and long entries triggered in the past week, reflecting choppy, range-bound conditions at these lower price levels. Overall, the market is consolidating near support after an extended decline, with no clear evidence yet of a sustained reversal. The technical backdrop remains bearish on higher timeframes, and the market is likely to require a significant catalyst to break out of this entrenched downtrend.
Chart Analysis ATS AI Generated: 2025-09-19 07:22 for Informational use only, not trading advice. Terms and Risk Disclosure Copyright © 2025. Algo Trading Systems LLC.
